29
/it/
it
AIzaSyAYiBZKx7MnpbEhh9jyipgxe19OcubqV5w
April 1, 2024
83687
Benin
BEN
true
2
1
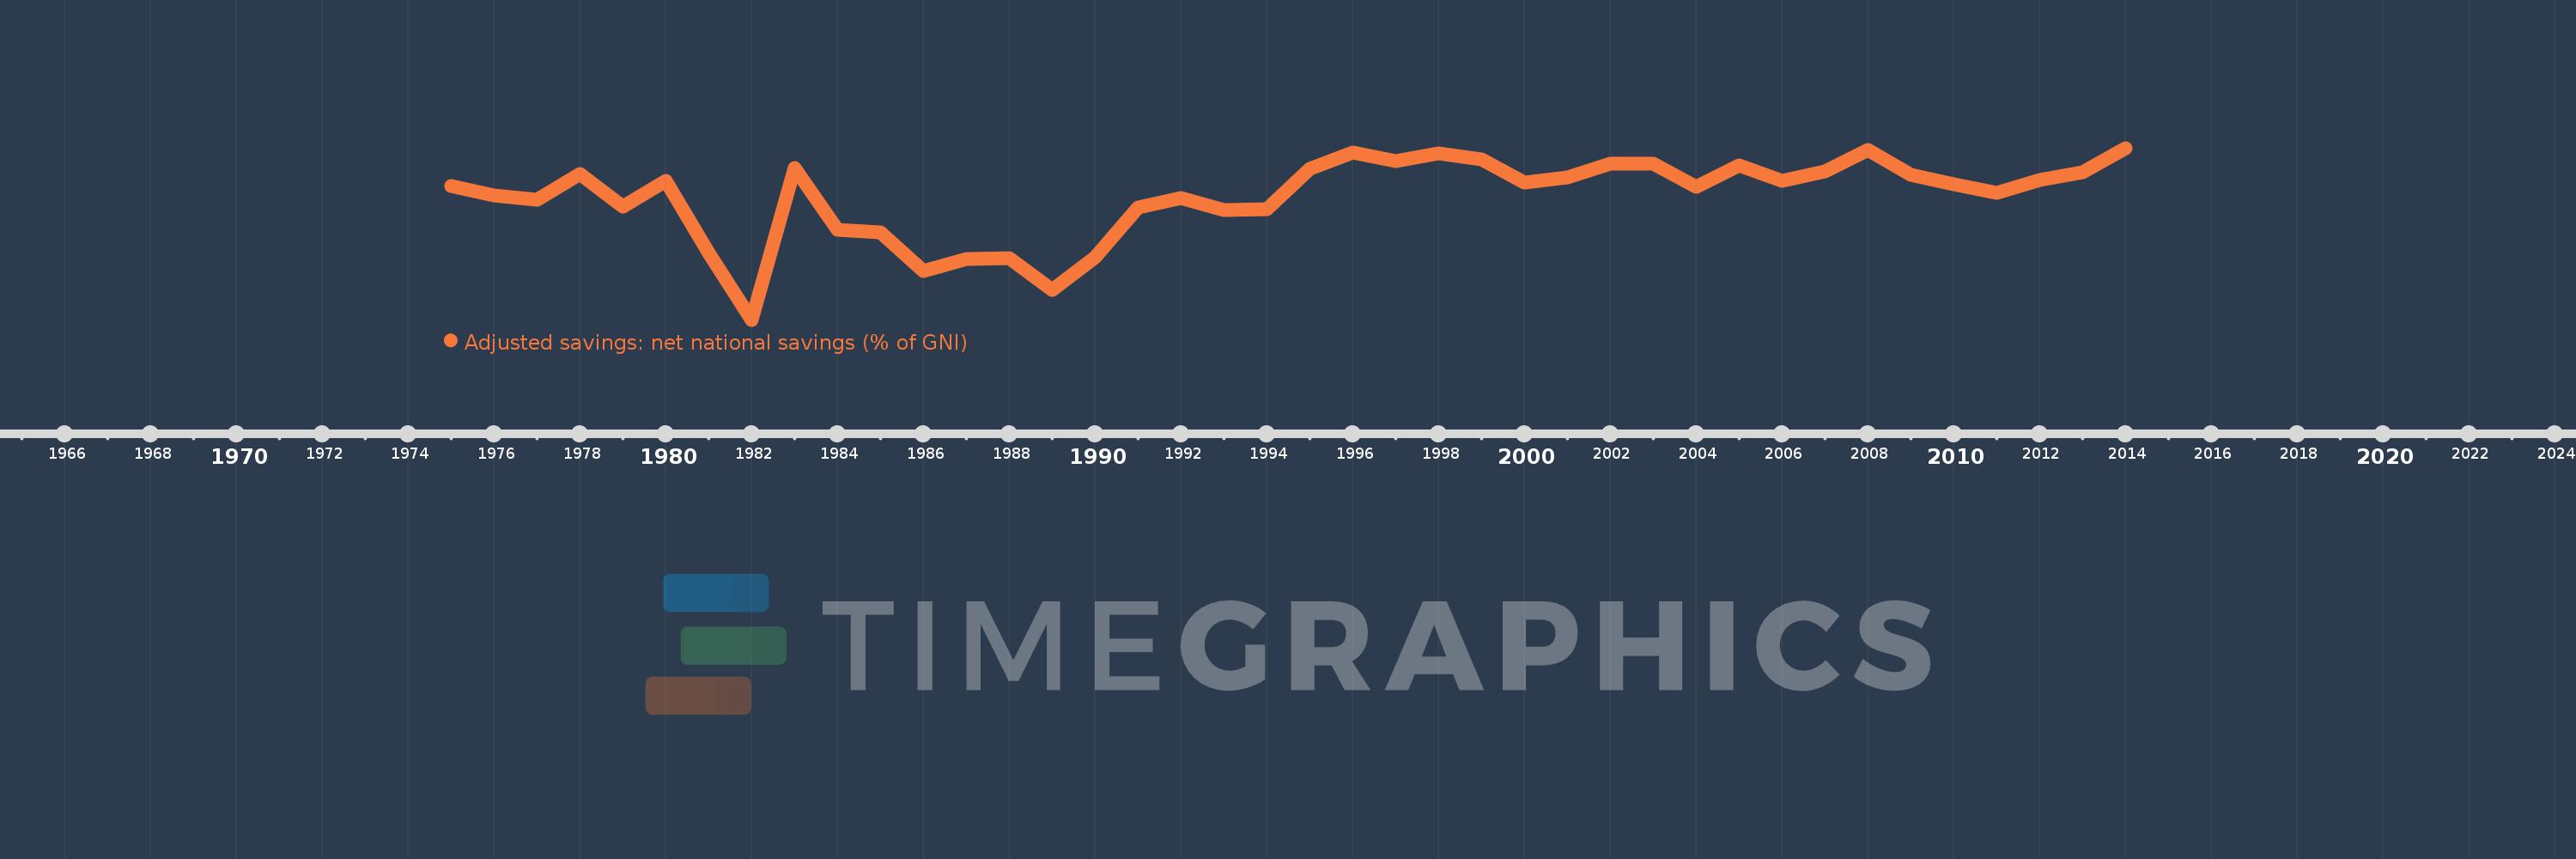
Adjusted savings: net national savings (% of GNI)
2014,2013,2012,2011,2010,2009,2008,2007,2006,2005,2004,2003,2002,2001,2000,1999,1998,1997,1996,1995,1994,1993,1992,1991,1990,1989,1988,1987,1986,1985,1984,1983,1982,1981,1980,1979,1978,1977,1976,1975
Queste statistiche in altri paesi:
AfghanistanAlbaniaAlgeriaAngolaAntigua and BarbudaArab WorldArgentinaArmeniaAustraliaAustriaAzerbaijanBahamas, TheBahrainBangladeshBarbadosBelarusBelgiumBelizeBeninBermudaBhutanBoliviaBosnia and HerzegovinaBotswanaBrazilBrunei DarussalamBulgariaBurkina FasoBurundiCabo VerdeCambodiaCameroonCanadaCaribbean small statesCentral African RepublicCentral Europe and the BalticsChadChileChinaColombiaComorosCongo, Dem. Rep.Congo, Rep.Costa RicaCote d'IvoireCroatiaCyprusCzech RepublicDenmarkDjiboutiDominicaDominican RepublicEarly-demographic dividendEast Asia & PacificEast Asia & Pacific (excluding high income)East Asia & Pacific (IDA & IBRD countries)EcuadorEgypt, Arab Rep.El SalvadorEquatorial GuineaEritreaEstoniaEthiopiaEuro areaEurope & Central AsiaEurope & Central Asia (excluding high income)Europe & Central Asia (IDA & IBRD countries)European UnionFijiFinlandFragile and conflict affected situationsFranceGabonGambia, TheGeorgiaGermanyGhanaGreeceGrenadaGuatemalaGuineaGuinea-BissauGuyanaHaitiHeavily indebted poor countries (HIPC)High incomeHondurasHong Kong SAR, ChinaHungaryIBRD onlyIcelandIDA & IBRD totalIDA blendIDA onlyIDA totalIndiaIndonesiaIran, Islamic Rep.IraqIrelandIsraelItalyJamaicaJapanJordanKazakhstanKenyaKiribatiKorea, Rep.KosovoKuwaitKyrgyz RepublicLao PDRLate-demographic dividendLatin America & Caribbean Latin America & Caribbean (excluding high income)Latin America & the Caribbean (IDA & IBRD countries)LatviaLeast developed countries: UN classificationLebanonLesothoLiberiaLibyaLithuaniaLow & middle incomeLow incomeLower middle incomeLuxembourgMacao SAR, ChinaMacedonia, FYRMadagascarMalawiMalaysiaMaldivesMaliMaltaMauritaniaMauritiusMexicoMiddle East & North AfricaMiddle East & North Africa (excluding high income)Middle East & North Africa (IDA & IBRD countries)Middle incomeMoldovaMongoliaMontenegroMoroccoMozambiqueNamibiaNepalNetherlandsNew ZealandNicaraguaNigerNigeriaNorth AmericaNorwayOECD membersOmanOther small statesPacific island small statesPakistanPanamaPapua New GuineaParaguayPeruPhilippinesPolandPortugalPost-demographic dividendPre-demographic dividendQatarRomaniaRussian FederationRwandaSaudi ArabiaSenegalSerbiaSeychellesSierra LeoneSingaporeSlovak RepublicSloveniaSmall statesSolomon IslandsSouth AfricaSouth AsiaSouth Asia (IDA & IBRD)SpainSri LankaSt. Kitts and NevisSt. LuciaSt. Vincent and the GrenadinesSub-Saharan Africa Sub-Saharan Africa (excluding high income)Sub-Saharan Africa (IDA & IBRD countries)SudanSurinameSwazilandSwedenSwitzerlandSyrian Arab RepublicTajikistanTanzaniaThailandTimor-LesteTogoTongaTrinidad and TobagoTunisiaTurkeyTurkmenistanUgandaUkraineUnited KingdomUnited StatesUpper middle incomeUruguayVanuatuVenezuela, RBVietnamWest Bank and GazaWorldYemen, Rep.ZambiaZimbabwe Linea del tempo:
Questa scala temporale mostra un grafico dal 1975 anno al 2014 anno. Benin. I dati fino ad 1974 anno non disponibili. Il numero di osservazioni attuali secondo i date: 40.
La fonte (nome):
Indicatori dello sviluppo mondiale
La fonte (organizzazione):
World Bank staff estimates based on sources and methods in World Bank's "The Changing Wealth of Nations: Measuring Sustainable Development in the New Millennium" (2011).
Categorie:
Economy & Growth, Environment
sono stati aggiornati
23 apr 2017 anni
Indicatori delle variazioni dei valori per anni
Minima:
-8.783
1 gen 1982 anni
Massimo:
10.693
1 gen 2014 anni
Alla data di osservazione
Valore
Variazione assoluta
La variazione rispetto al valore precedente
1 gen 1975 anni
6.427
+6.427
0.0%
1 gen 1976 anni
5.269
-1.158
-18.02%
1 gen 1977 anni
4.851
-0.418
-7.94%
1 gen 1978 anni
7.708
+2.857
58.9%
1 gen 1979 anni
4.032
-3.676
-47.69%
1 gen 1980 anni
6.946
+2.914
72.27%
1 gen 1981 anni
-1.182
-8.128
-117.02%
1 gen 1982 anni
-8.783
-7.601
642.95%
1 gen 1983 anni
8.408
+17.191
-195.73%
1 gen 1984 anni
1.401
-7.006
-83.33%
1 gen 1985 anni
1.092
-0.31
-22.1%
1 gen 1986 anni
-3.286
-4.378
-401.01%
1 gen 1987 anni
-1.939
+1.347
-41.0%
1 gen 1988 anni
-1.805
+0.133
-6.88%
1 gen 1989 anni
-5.368
-3.562
197.29%
1 gen 1990 anni
-1.71
+3.658
-68.15%
1 gen 1991 anni
3.932
+5.641
-329.97%
1 gen 1992 anni
5.004
+1.072
27.26%
1 gen 1993 anni
3.671
-1.333
-26.63%
1 gen 1994 anni
3.79
+0.119
3.24%
1 gen 1995 anni
8.306
+4.516
119.15%
1 gen 1996 anni
10.217
+1.911
23.01%
1 gen 1997 anni
9.215
-1.002
-9.81%
1 gen 1998 anni
10.08
+0.865
9.39%
1 gen 1999 anni
9.445
-0.634
-6.29%
1 gen 2000 anni
6.765
-2.68
-28.38%
1 gen 2001 anni
7.305
+0.54
7.98%
1 gen 2002 anni
8.911
+1.606
21.99%
1 gen 2003 anni
8.936
+0.025
0.28%
1 gen 2004 anni
6.258
-2.678
-29.97%
1 gen 2005 anni
8.7
+2.442
39.02%
1 gen 2006 anni
6.971
-1.73
-19.88%
1 gen 2007 anni
7.988
+1.017
14.59%
1 gen 2008 anni
10.44
+2.452
30.7%
1 gen 2009 anni
7.604
-2.836
-27.17%
1 gen 2010 anni
6.557
-1.047
-13.77%
1 gen 2011 anni
5.626
-0.93
-14.19%
1 gen 2012 anni
7.047
+1.42
25.25%
1 gen 2013 anni
7.901
+0.854
12.12%
1 gen 2014 anni
10.693
+2.793
35.35%
Classificazione dei paesi secondo i statistiche attuali per anni


Commenti: