29
/it/
it
AIzaSyAYiBZKx7MnpbEhh9jyipgxe19OcubqV5w
April 1, 2024
252659
Sudan
SDN
true
2
1
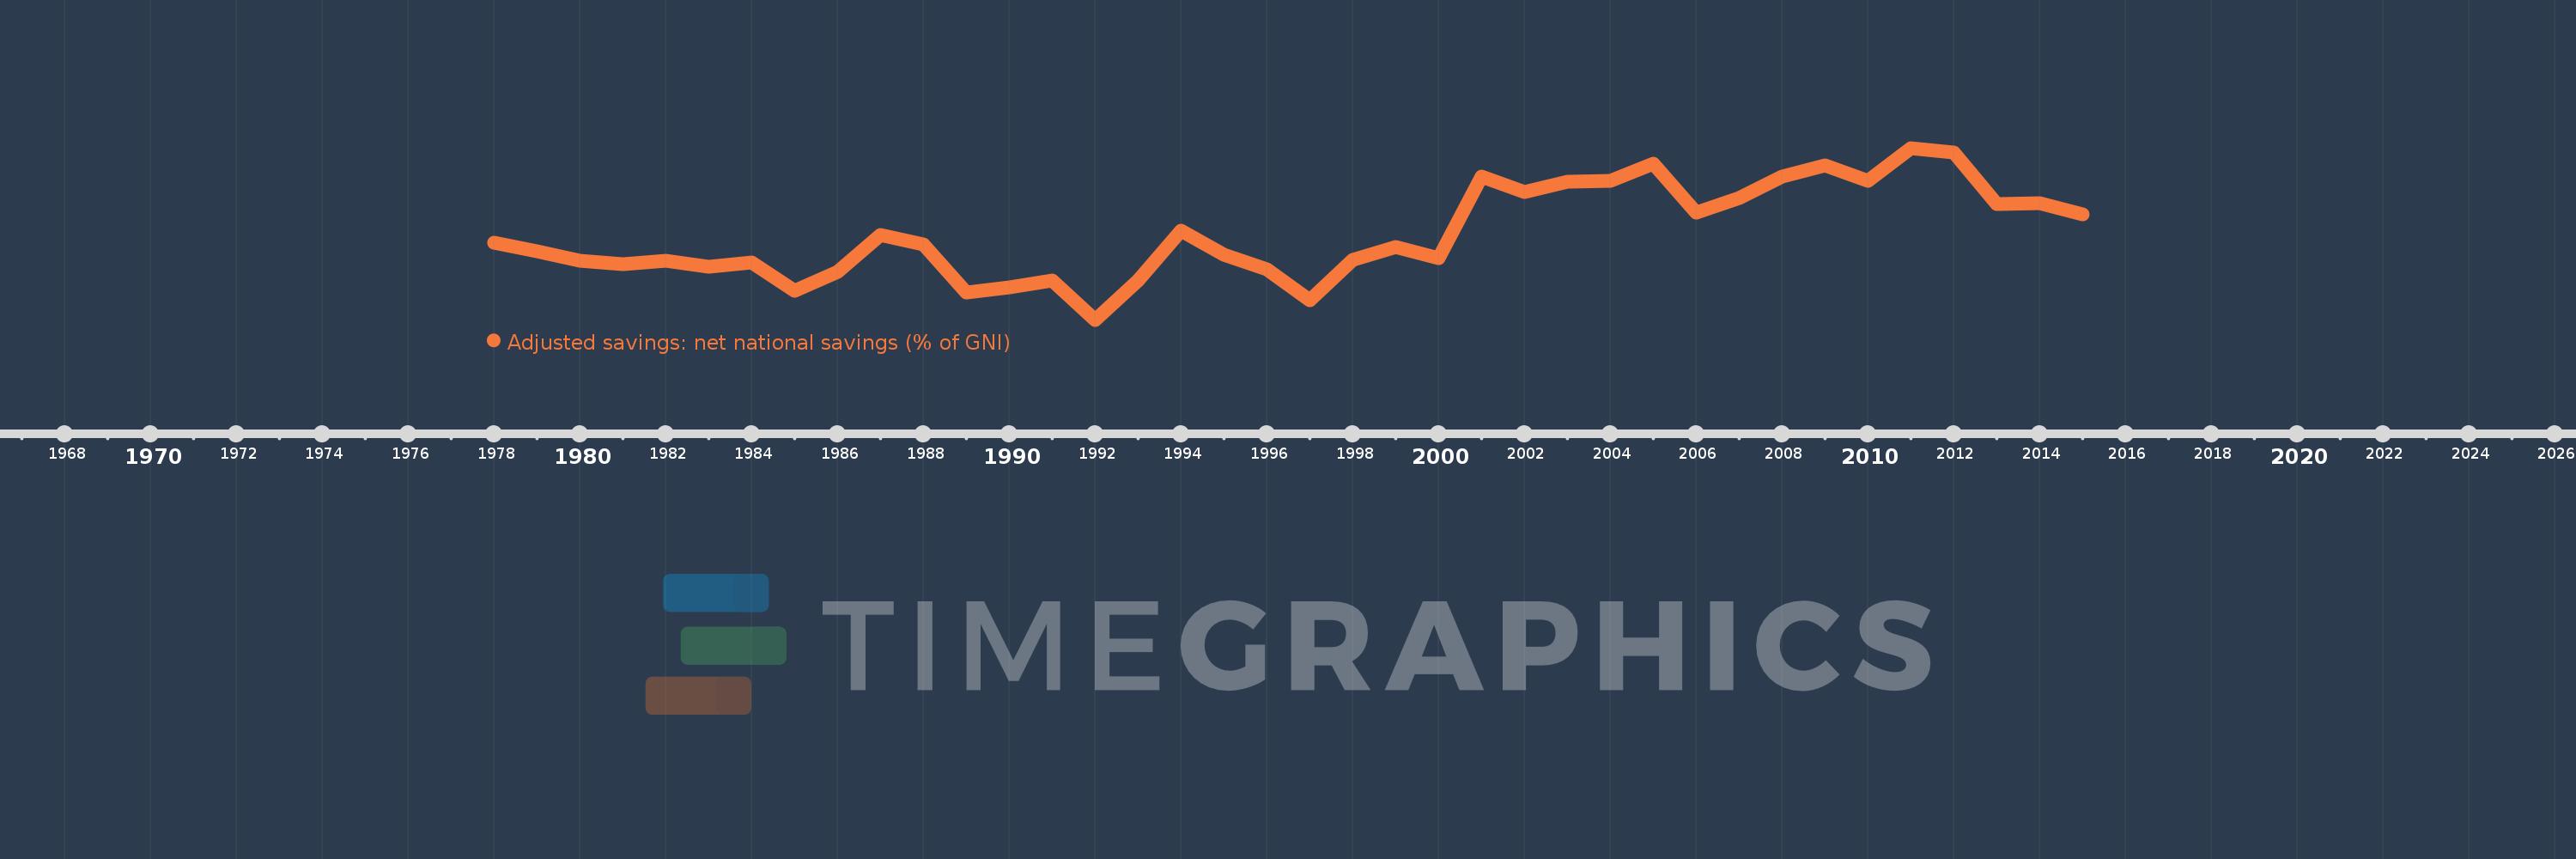
Adjusted savings: net national savings (% of GNI)
2015,2014,2013,2012,2011,2010,2009,2008,2007,2006,2005,2004,2003,2002,2001,2000,1999,1998,1997,1996,1995,1994,1993,1992,1991,1990,1989,1988,1987,1986,1985,1984,1983,1982,1981,1980,1979,1978
Queste statistiche in altri paesi:
AfghanistanAlbaniaAlgeriaAngolaAntigua and BarbudaArab WorldArgentinaArmeniaAustraliaAustriaAzerbaijanBahamas, TheBahrainBangladeshBarbadosBelarusBelgiumBelizeBeninBermudaBhutanBoliviaBosnia and HerzegovinaBotswanaBrazilBrunei DarussalamBulgariaBurkina FasoBurundiCabo VerdeCambodiaCameroonCanadaCaribbean small statesCentral African RepublicCentral Europe and the BalticsChadChileChinaColombiaComorosCongo, Dem. Rep.Congo, Rep.Costa RicaCote d'IvoireCroatiaCyprusCzech RepublicDenmarkDjiboutiDominicaDominican RepublicEarly-demographic dividendEast Asia & PacificEast Asia & Pacific (excluding high income)East Asia & Pacific (IDA & IBRD countries)EcuadorEgypt, Arab Rep.El SalvadorEquatorial GuineaEritreaEstoniaEthiopiaEuro areaEurope & Central AsiaEurope & Central Asia (excluding high income)Europe & Central Asia (IDA & IBRD countries)European UnionFijiFinlandFragile and conflict affected situationsFranceGabonGambia, TheGeorgiaGermanyGhanaGreeceGrenadaGuatemalaGuineaGuinea-BissauGuyanaHaitiHeavily indebted poor countries (HIPC)High incomeHondurasHong Kong SAR, ChinaHungaryIBRD onlyIcelandIDA & IBRD totalIDA blendIDA onlyIDA totalIndiaIndonesiaIran, Islamic Rep.IraqIrelandIsraelItalyJamaicaJapanJordanKazakhstanKenyaKiribatiKorea, Rep.KosovoKuwaitKyrgyz RepublicLao PDRLate-demographic dividendLatin America & Caribbean Latin America & Caribbean (excluding high income)Latin America & the Caribbean (IDA & IBRD countries)LatviaLeast developed countries: UN classificationLebanonLesothoLiberiaLibyaLithuaniaLow & middle incomeLow incomeLower middle incomeLuxembourgMacao SAR, ChinaMacedonia, FYRMadagascarMalawiMalaysiaMaldivesMaliMaltaMauritaniaMauritiusMexicoMiddle East & North AfricaMiddle East & North Africa (excluding high income)Middle East & North Africa (IDA & IBRD countries)Middle incomeMoldovaMongoliaMontenegroMoroccoMozambiqueNamibiaNepalNetherlandsNew ZealandNicaraguaNigerNigeriaNorth AmericaNorwayOECD membersOmanOther small statesPacific island small statesPakistanPanamaPapua New GuineaParaguayPeruPhilippinesPolandPortugalPost-demographic dividendPre-demographic dividendQatarRomaniaRussian FederationRwandaSaudi ArabiaSenegalSerbiaSeychellesSierra LeoneSingaporeSlovak RepublicSloveniaSmall statesSolomon IslandsSouth AfricaSouth AsiaSouth Asia (IDA & IBRD)SpainSri LankaSt. Kitts and NevisSt. LuciaSt. Vincent and the GrenadinesSub-Saharan Africa Sub-Saharan Africa (excluding high income)Sub-Saharan Africa (IDA & IBRD countries)SudanSurinameSwazilandSwedenSwitzerlandSyrian Arab RepublicTajikistanTanzaniaThailandTimor-LesteTogoTongaTrinidad and TobagoTunisiaTurkeyTurkmenistanUgandaUkraineUnited KingdomUnited StatesUpper middle incomeUruguayVanuatuVenezuela, RBVietnamWest Bank and GazaWorldYemen, Rep.ZambiaZimbabwe Linea del tempo:
Questa scala temporale mostra un grafico dal 1978 anno al 2015 anno. Sudan. I dati fino ad 1977 anno non disponibili. Il numero di osservazioni attuali secondo i date: 38.
La fonte (nome):
Indicatori dello sviluppo mondiale
La fonte (organizzazione):
World Bank staff estimates based on sources and methods in World Bank's "The Changing Wealth of Nations: Measuring Sustainable Development in the New Millennium" (2011).
Categorie:
Economy & Growth, Environment
sono stati aggiornati
23 apr 2017 anni
Indicatori delle variazioni dei valori per anni
Minima:
-12.354
1 gen 1992 anni
Massimo:
21.262
1 gen 2011 anni
Alla data di osservazione
Valore
Variazione assoluta
La variazione rispetto al valore precedente
1 gen 1978 anni
2.698
+2.698
0.0%
1 gen 1979 anni
0.965
-1.732
-64.21%
1 gen 1980 anni
-0.729
-1.694
-175.46%
1 gen 1981 anni
-1.441
-0.712
97.78%
1 gen 1982 anni
-0.739
+0.702
-48.73%
1 gen 1983 anni
-2.055
-1.316
178.09%
1 gen 1984 anni
-1.08
+0.974
-47.42%
1 gen 1985 anni
-6.735
-5.655
523.48%
1 gen 1986 anni
-2.967
+3.768
-55.95%
1 gen 1987 anni
4.224
+7.191
-242.36%
1 gen 1988 anni
2.456
-1.768
-41.86%
1 gen 1989 anni
-6.992
-9.448
-384.75%
1 gen 1990 anni
-6.001
+0.991
-14.17%
1 gen 1991 anni
-4.597
+1.404
-23.4%
1 gen 1992 anni
-12.354
-7.758
168.75%
1 gen 1993 anni
-4.672
+7.682
-62.18%
1 gen 1994 anni
5.122
+9.794
-209.62%
1 gen 1995 anni
0.416
-4.706
-91.88%
1 gen 1996 anni
-2.42
-2.836
-682.27%
1 gen 1997 anni
-8.464
-6.043
249.68%
1 gen 1998 anni
-0.605
+7.859
-92.85%
1 gen 1999 anni
1.905
+2.509
-414.93%
1 gen 2000 anni
-0.378
-2.282
-119.84%
1 gen 2001 anni
15.64
+16.018
-4.24 Mille.%
1 gen 2002 anni
12.678
-2.962
-18.94%
1 gen 2003 anni
14.673
+1.996
15.74%
1 gen 2004 anni
14.77
+0.097
0.66%
1 gen 2005 anni
18.212
+3.442
23.3%
1 gen 2006 anni
8.581
-9.631
-52.88%
1 gen 2007 anni
11.38
+2.799
32.62%
1 gen 2008 anni
15.591
+4.211
37.01%
1 gen 2009 anni
17.807
+2.215
14.21%
1 gen 2010 anni
14.817
-2.99
-16.79%
1 gen 2011 anni
21.262
+6.446
43.5%
1 gen 2012 anni
20.404
-0.859
-4.04%
1 gen 2013 anni
10.209
-10.195
-49.96%
1 gen 2014 anni
10.508
+0.298
2.92%
1 gen 2015 anni
8.254
-2.253
-21.45%
Classificazione dei paesi secondo i statistiche attuali per anni


Commenti: