29
/it/
it
AIzaSyAYiBZKx7MnpbEhh9jyipgxe19OcubqV5w
April 1, 2024
42070
Latin America & Caribbean (excluding high income)
LAC
false
2
1
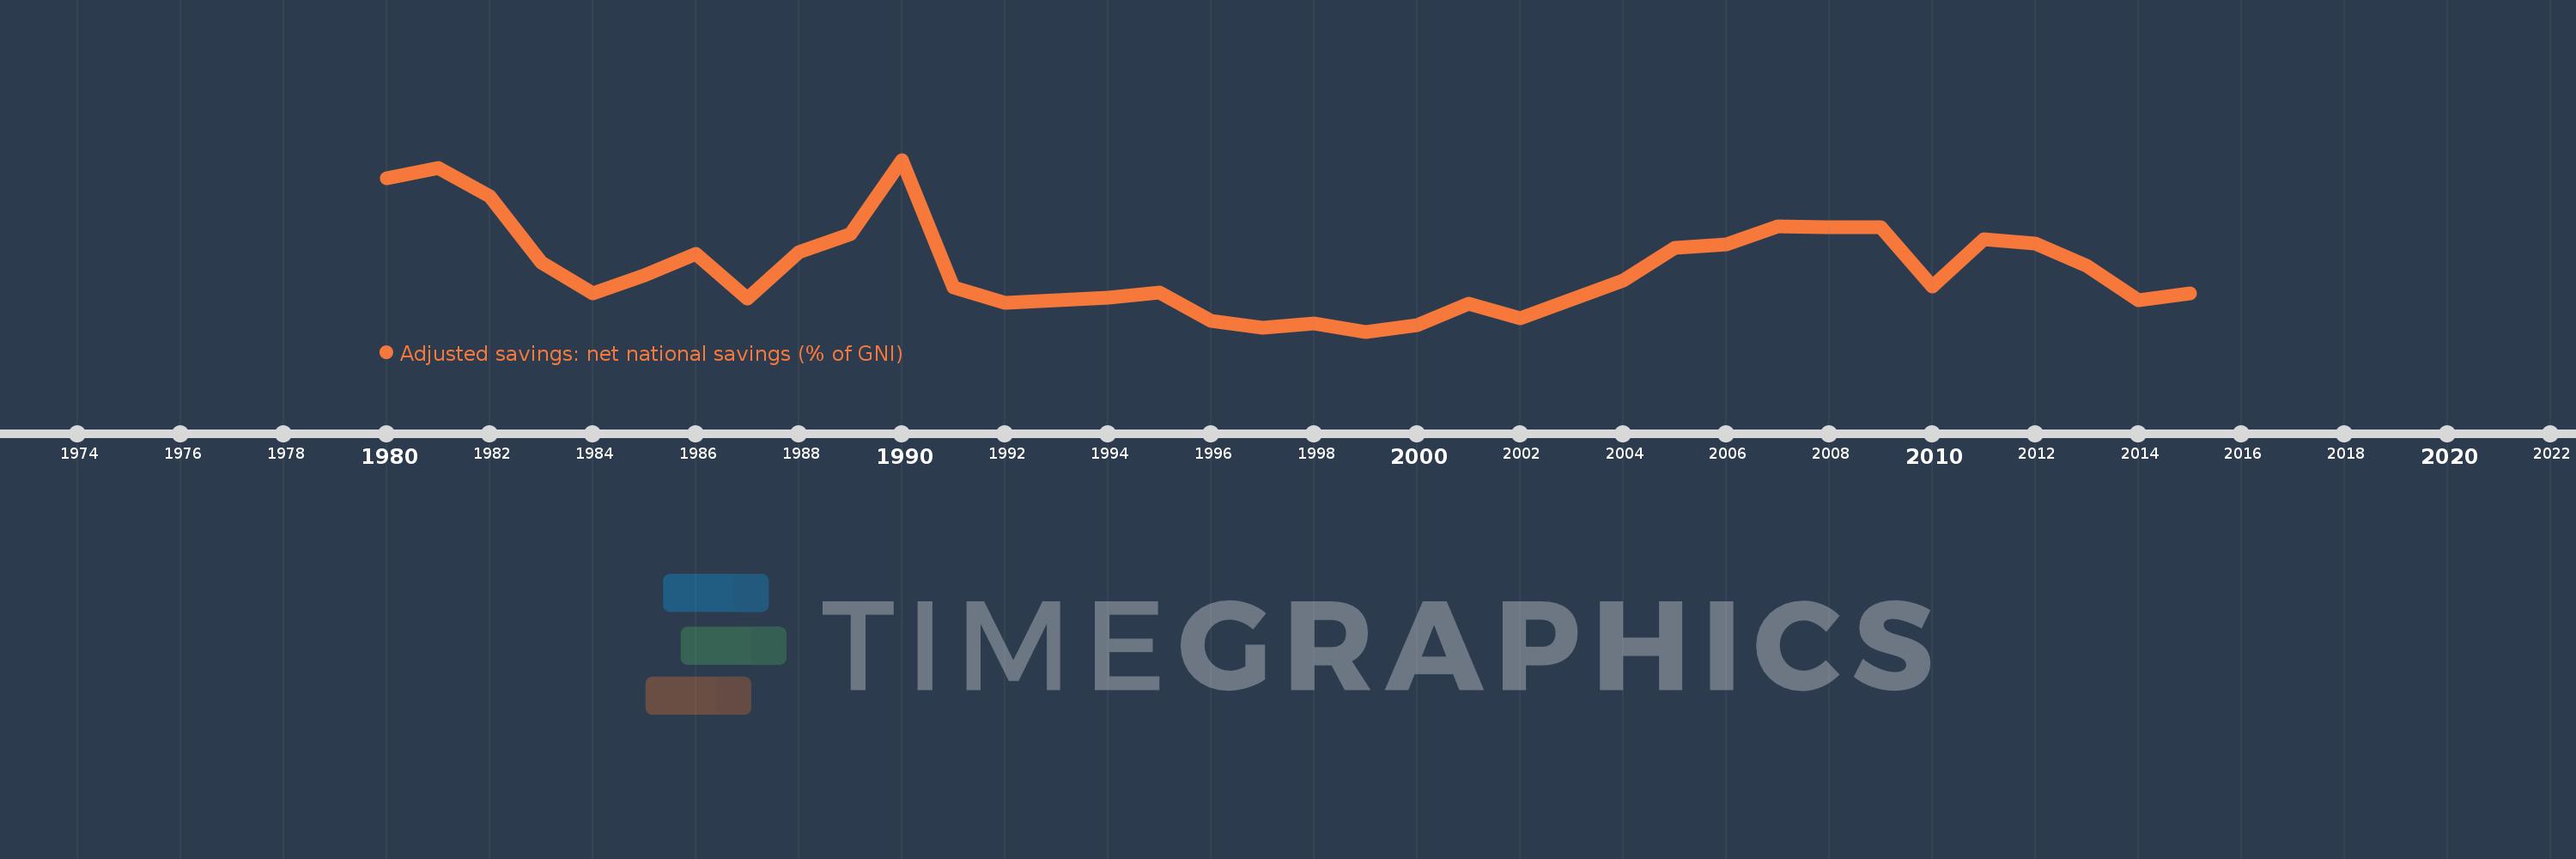
Adjusted savings: net national savings (% of GNI)
2015,2014,2013,2012,2011,2010,2009,2008,2007,2006,2005,2004,2003,2002,2001,2000,1999,1998,1997,1996,1995,1994,1993,1992,1991,1990,1989,1988,1987,1986,1985,1984,1983,1982,1981,1980
Queste statistiche in altri paesi:
AfghanistanAlbaniaAlgeriaAngolaAntigua and BarbudaArab WorldArgentinaArmeniaAustraliaAustriaAzerbaijanBahamas, TheBahrainBangladeshBarbadosBelarusBelgiumBelizeBeninBermudaBhutanBoliviaBosnia and HerzegovinaBotswanaBrazilBrunei DarussalamBulgariaBurkina FasoBurundiCabo VerdeCambodiaCameroonCanadaCaribbean small statesCentral African RepublicCentral Europe and the BalticsChadChileChinaColombiaComorosCongo, Dem. Rep.Congo, Rep.Costa RicaCote d'IvoireCroatiaCyprusCzech RepublicDenmarkDjiboutiDominicaDominican RepublicEarly-demographic dividendEast Asia & PacificEast Asia & Pacific (excluding high income)East Asia & Pacific (IDA & IBRD countries)EcuadorEgypt, Arab Rep.El SalvadorEquatorial GuineaEritreaEstoniaEthiopiaEuro areaEurope & Central AsiaEurope & Central Asia (excluding high income)Europe & Central Asia (IDA & IBRD countries)European UnionFijiFinlandFragile and conflict affected situationsFranceGabonGambia, TheGeorgiaGermanyGhanaGreeceGrenadaGuatemalaGuineaGuinea-BissauGuyanaHaitiHeavily indebted poor countries (HIPC)High incomeHondurasHong Kong SAR, ChinaHungaryIBRD onlyIcelandIDA & IBRD totalIDA blendIDA onlyIDA totalIndiaIndonesiaIran, Islamic Rep.IraqIrelandIsraelItalyJamaicaJapanJordanKazakhstanKenyaKiribatiKorea, Rep.KosovoKuwaitKyrgyz RepublicLao PDRLate-demographic dividendLatin America & Caribbean Latin America & Caribbean (excluding high income)Latin America & the Caribbean (IDA & IBRD countries)LatviaLeast developed countries: UN classificationLebanonLesothoLiberiaLibyaLithuaniaLow & middle incomeLow incomeLower middle incomeLuxembourgMacao SAR, ChinaMacedonia, FYRMadagascarMalawiMalaysiaMaldivesMaliMaltaMauritaniaMauritiusMexicoMiddle East & North AfricaMiddle East & North Africa (excluding high income)Middle East & North Africa (IDA & IBRD countries)Middle incomeMoldovaMongoliaMontenegroMoroccoMozambiqueNamibiaNepalNetherlandsNew ZealandNicaraguaNigerNigeriaNorth AmericaNorwayOECD membersOmanOther small statesPacific island small statesPakistanPanamaPapua New GuineaParaguayPeruPhilippinesPolandPortugalPost-demographic dividendPre-demographic dividendQatarRomaniaRussian FederationRwandaSaudi ArabiaSenegalSerbiaSeychellesSierra LeoneSingaporeSlovak RepublicSloveniaSmall statesSolomon IslandsSouth AfricaSouth AsiaSouth Asia (IDA & IBRD)SpainSri LankaSt. Kitts and NevisSt. LuciaSt. Vincent and the GrenadinesSub-Saharan Africa Sub-Saharan Africa (excluding high income)Sub-Saharan Africa (IDA & IBRD countries)SudanSurinameSwazilandSwedenSwitzerlandSyrian Arab RepublicTajikistanTanzaniaThailandTimor-LesteTogoTongaTrinidad and TobagoTunisiaTurkeyTurkmenistanUgandaUkraineUnited KingdomUnited StatesUpper middle incomeUruguayVanuatuVenezuela, RBVietnamWest Bank and GazaWorldYemen, Rep.ZambiaZimbabwe Linea del tempo:
Questa scala temporale mostra un grafico dal 1980 anno al 2015 anno. Latin America & Caribbean (excluding high income). I dati fino ad 1979 anno non disponibili. Il numero di osservazioni attuali secondo i date: 36.
La fonte (nome):
Indicatori dello sviluppo mondiale
La fonte (organizzazione):
World Bank staff estimates based on sources and methods in World Bank's "The Changing Wealth of Nations: Measuring Sustainable Development in the New Millennium" (2011).
Categorie:
Economy & Growth, Environment
sono stati aggiornati
23 apr 2017 anni
Indicatori delle variazioni dei valori per anni
Minima:
4.528
1 gen 1999 anni
Massimo:
16.313
1 gen 1990 anni
Alla data di osservazione
Valore
Variazione assoluta
La variazione rispetto al valore precedente
1 gen 1980 anni
15.049
+15.049
0.0%
1 gen 1981 anni
15.751
+0.702
4.67%
1 gen 1982 anni
13.78
-1.97
-12.51%
1 gen 1983 anni
9.28
-4.5
-32.66%
1 gen 1984 anni
7.131
-2.149
-23.16%
1 gen 1985 anni
8.361
+1.23
17.25%
1 gen 1986 anni
9.865
+1.504
17.99%
1 gen 1987 anni
6.811
-3.054
-30.96%
1 gen 1988 anni
9.969
+3.157
46.35%
1 gen 1989 anni
11.221
+1.252
12.56%
1 gen 1990 anni
16.313
+5.093
45.39%
1 gen 1991 anni
7.582
-8.732
-53.53%
1 gen 1992 anni
6.504
-1.077
-14.21%
1 gen 1993 anni
6.681
+0.177
2.71%
1 gen 1994 anni
6.854
+0.174
2.6%
1 gen 1995 anni
7.186
+0.331
4.83%
1 gen 1996 anni
5.257
-1.928
-26.84%
1 gen 1997 anni
4.812
-0.445
-8.47%
1 gen 1998 anni
5.088
+0.276
5.73%
1 gen 1999 anni
4.528
-0.559
-11.0%
1 gen 2000 anni
4.972
+0.443
9.79%
1 gen 2001 anni
6.42
+1.448
29.13%
1 gen 2002 anni
5.464
-0.956
-14.89%
1 gen 2003 anni
6.766
+1.302
23.83%
1 gen 2004 anni
8.053
+1.288
19.03%
1 gen 2005 anni
10.258
+2.205
27.37%
1 gen 2006 anni
10.527
+0.269
2.62%
1 gen 2007 anni
11.743
+1.216
11.55%
1 gen 2008 anni
11.664
-0.079
-0.67%
1 gen 2009 anni
11.701
+0.037
0.31%
1 gen 2010 anni
7.615
-4.086
-34.92%
1 gen 2011 anni
10.872
+3.257
42.77%
1 gen 2012 anni
10.56
-0.312
-2.87%
1 gen 2013 anni
9.03
-1.53
-14.49%
1 gen 2014 anni
6.675
-2.355
-26.08%
1 gen 2015 anni
7.166
+0.491
7.36%
Classificazione dei paesi secondo i statistiche attuali per anni


Commenti: