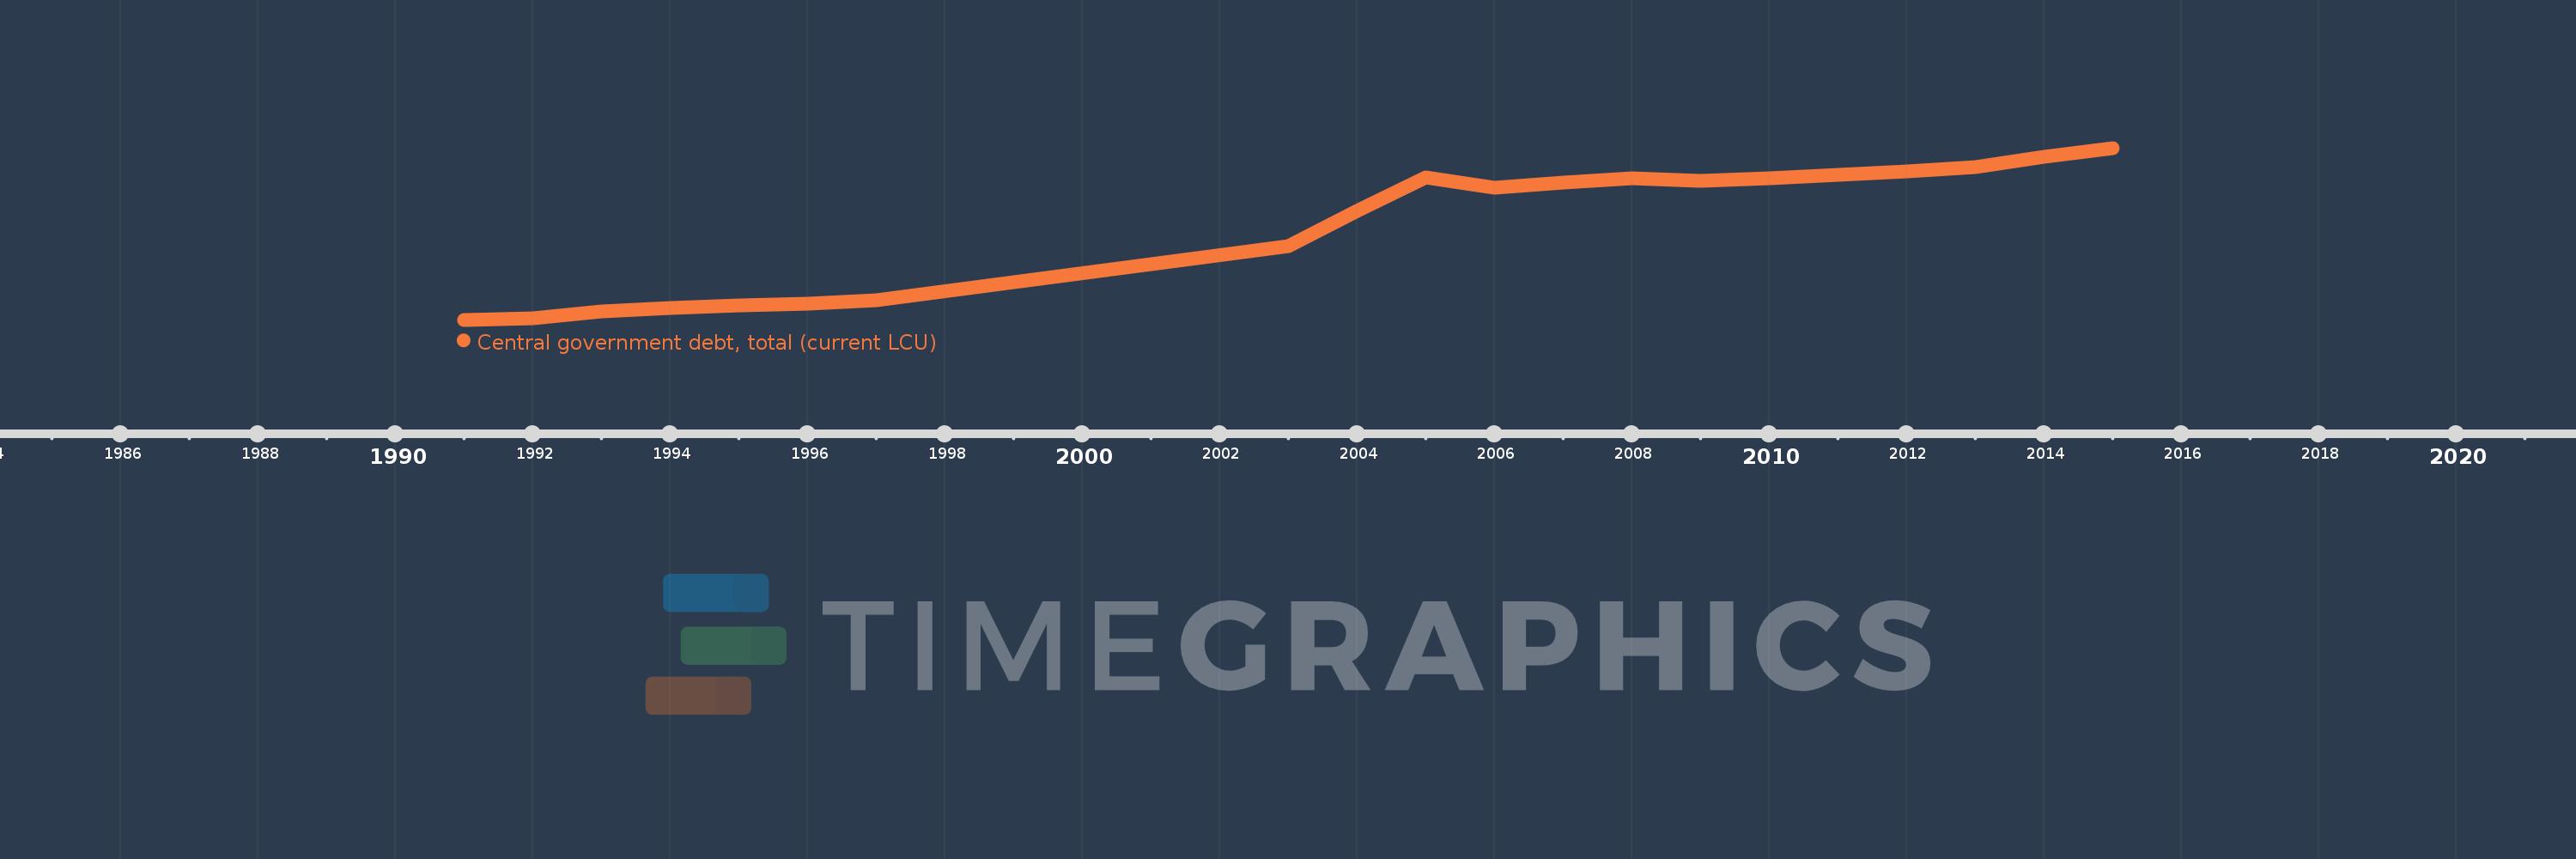
Questa scala temporale mostra un grafico dal 1991 anno al 2015 anno. Belize. I dati fino ad 1990 anno non disponibili. Il numero di osservazioni attuali secondo i date: 20.
La fonte (nome):
Indicatori dello sviluppo mondiale
La fonte (organizzazione):
International Monetary Fund, Government Finance Statistics Yearbook and data files.
Categorie:
Public Sector
sono stati aggiornati
23 apr 2017 anni
Indicatori delle variazioni dei valori per anni
In media:
1.525 Mlrd
Minima:
231.832 Mln
1 gen 1991 anni
Massimo:
2.61 Mlrd
1 gen 2015 anni
Alla data di osservazione
Valore
Variazione assoluta
La variazione rispetto al valore precedente
1 gen 1991 anni
231.832 Mln
+231.832 Mln
0.0%
1 gen 1992 anni
254.767 Mln
+22.935 Mln
9.89%
1 gen 1993 anni
341.625 Mln
+86.858 Mln
34.09%
1 gen 1994 anni
395.557 Mln
+53.932 Mln
15.79%
1 gen 1995 anni
431.785 Mln
+36.228 Mln
9.16%
1 gen 1996 anni
450.357 Mln
+18.572 Mln
4.3%
1 gen 1997 anni
498.128 Mln
+47.771 Mln
10.61%
1 gen 2003 anni
1.255 Mlrd
+756.507 Mln
151.87%
1 gen 2004 anni
1.743 Mlrd
+488.402 Mln
38.93%
1 gen 2005 anni
2.2 Mlrd
+457.089 Mln
26.22%
1 gen 2006 anni
2.055 Mlrd
-145.432 Mln
-6.61%
1 gen 2007 anni
2.134 Mlrd
+79.746 Mln
3.88%
1 gen 2008 anni
2.187 Mlrd
+52.809 Mln
2.47%
1 gen 2009 anni
2.157 Mlrd
-30.409 Mln
-1.39%
1 gen 2010 anni
2.193 Mlrd
+35.887 Mln
1.66%
1 gen 2011 anni
2.24 Mlrd
+47.346 Mln
2.16%
1 gen 2012 anni
2.286 Mlrd
+46.175 Mln
2.06%
1 gen 2013 anni
2.344 Mlrd
+57.906 Mln
2.53%
1 gen 2014 anni
2.488 Mlrd
+144.246 Mln
6.15%
1 gen 2015 anni
2.61 Mlrd
+121.574 Mln
4.89%
Classificazione dei paesi secondo i statistiche attuali per anni
