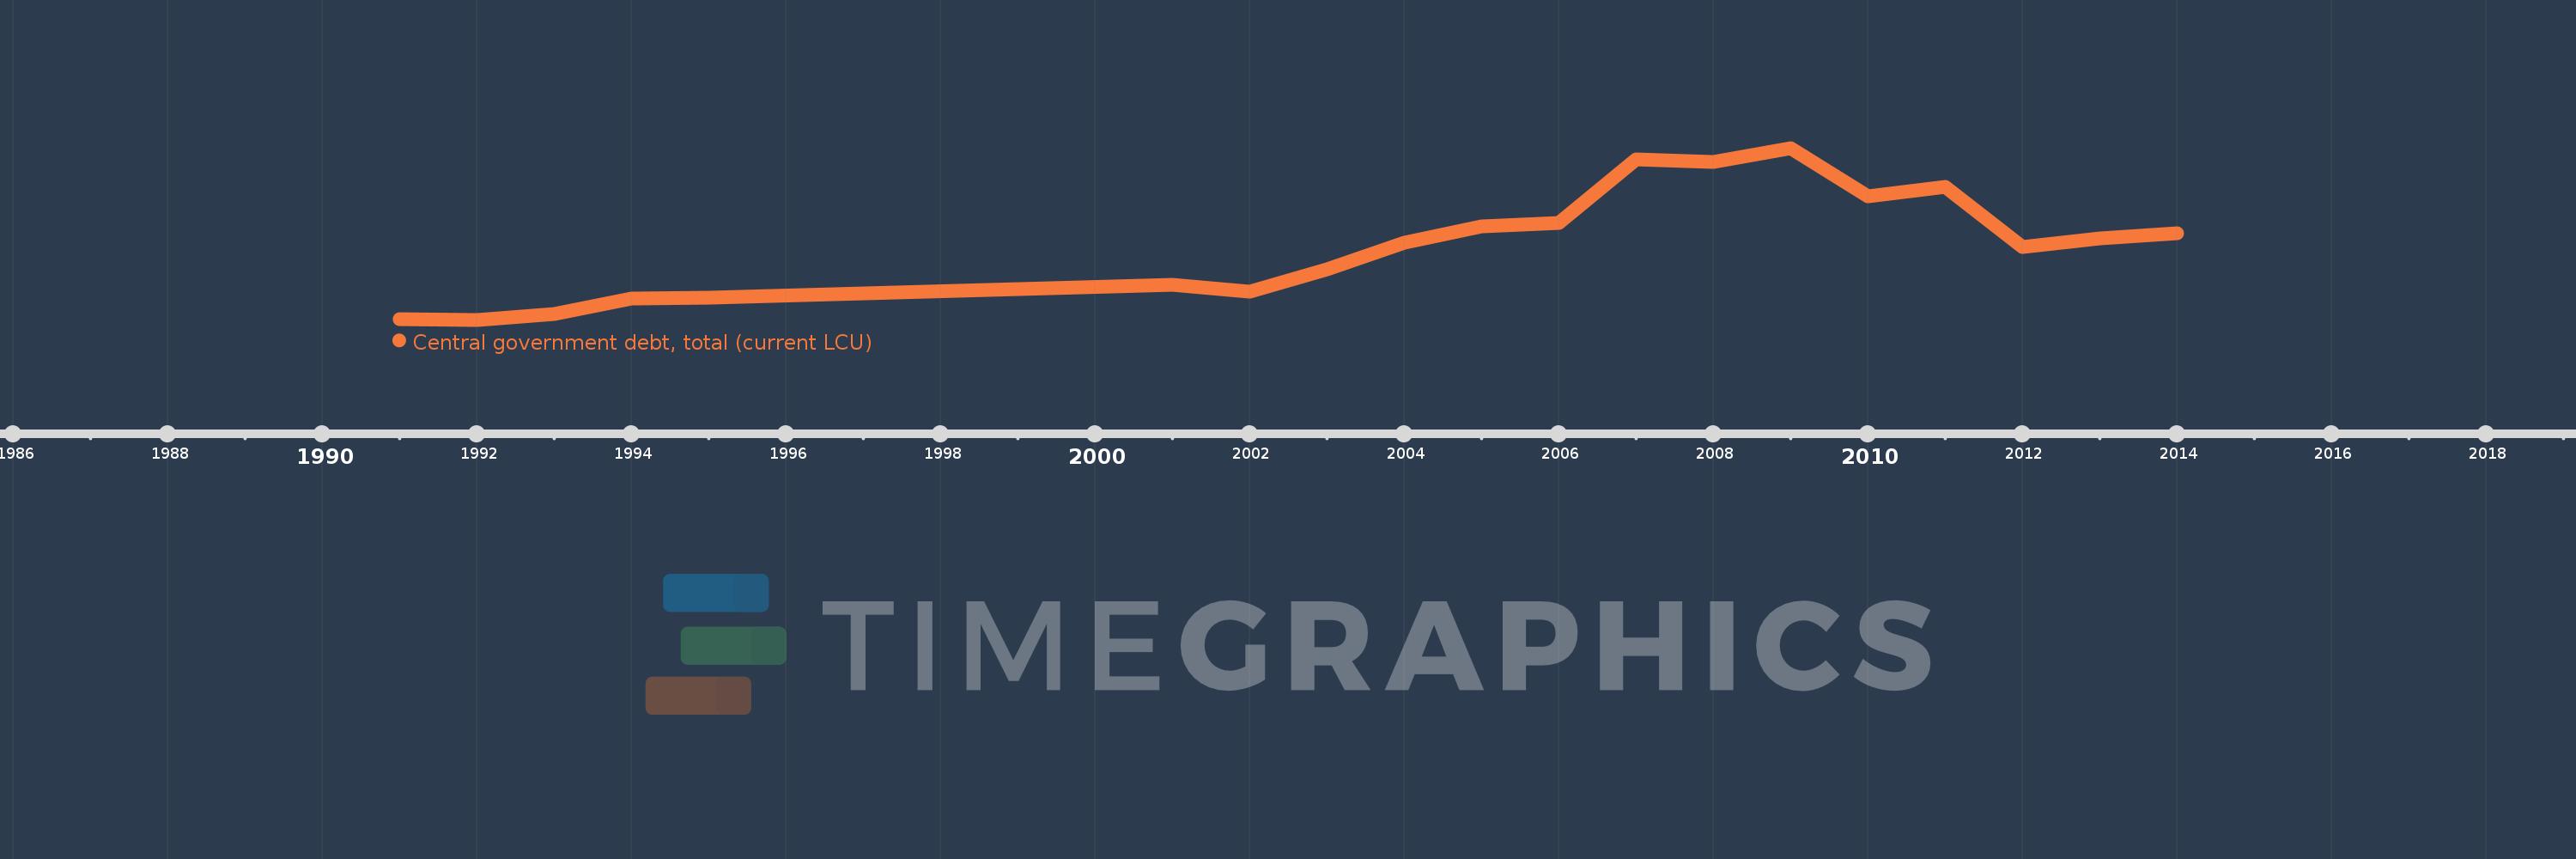
Questa scala temporale mostra un grafico dal 1991 anno al 2014 anno. Norway. I dati fino ad 1990 anno non disponibili. Il numero di osservazioni attuali secondo i date: 19.
La fonte (nome):
Indicatori dello sviluppo mondiale
La fonte (organizzazione):
International Monetary Fund, Government Finance Statistics Yearbook and data files.
Categorie:
Public Sector
sono stati aggiornati
23 apr 2017 anni
Indicatori delle variazioni dei valori per anni
In media:
575.642 Mlrd
Minima:
146.911 Mlrd
1 gen 1992 anni
Massimo:
1.134 Trln
1 gen 2009 anni
Alla data di osservazione
Valore
Variazione assoluta
La variazione rispetto al valore precedente
1 gen 1991 anni
148.825 Mlrd
+148.825 Mlrd
0.0%
1 gen 1992 anni
146.911 Mlrd
-1.914 Mlrd
-1.29%
1 gen 1993 anni
181.668 Mlrd
+34.757 Mlrd
23.66%
1 gen 1994 anni
269.971 Mlrd
+88.303 Mlrd
48.61%
1 gen 1995 anni
275.92 Mlrd
+5.949 Mlrd
2.2%
1 gen 2001 anni
347.662 Mlrd
+71.742 Mlrd
26.0%
1 gen 2002 anni
306.22 Mlrd
-41.442 Mlrd
-11.92%
1 gen 2003 anni
438.084 Mlrd
+131.864 Mlrd
43.06%
1 gen 2004 anni
587.464 Mlrd
+149.38 Mlrd
34.1%
1 gen 2005 anni
682.841 Mlrd
+95.377 Mlrd
16.24%
1 gen 2006 anni
703.507 Mlrd
+20.666 Mlrd
3.03%
1 gen 2007 anni
1.068 Trln
+364.011 Mlrd
51.74%
1 gen 2008 anni
1.055 Trln
-12.908 Mlrd
-1.21%
1 gen 2009 anni
1.134 Trln
+79.139 Mlrd
7.5%
1 gen 2010 anni
856.924 Mlrd
-276.825 Mlrd
-24.42%
1 gen 2011 anni
910.1 Mlrd
+53.176 Mlrd
6.21%
1 gen 2012 anni
566.2 Mlrd
-343.9 Mlrd
-37.79%
1 gen 2013 anni
616.02 Mlrd
+49.82 Mlrd
8.8%
1 gen 2014 anni
643.01 Mlrd
+26.99 Mlrd
4.38%
Classificazione dei paesi secondo i statistiche attuali per anni
