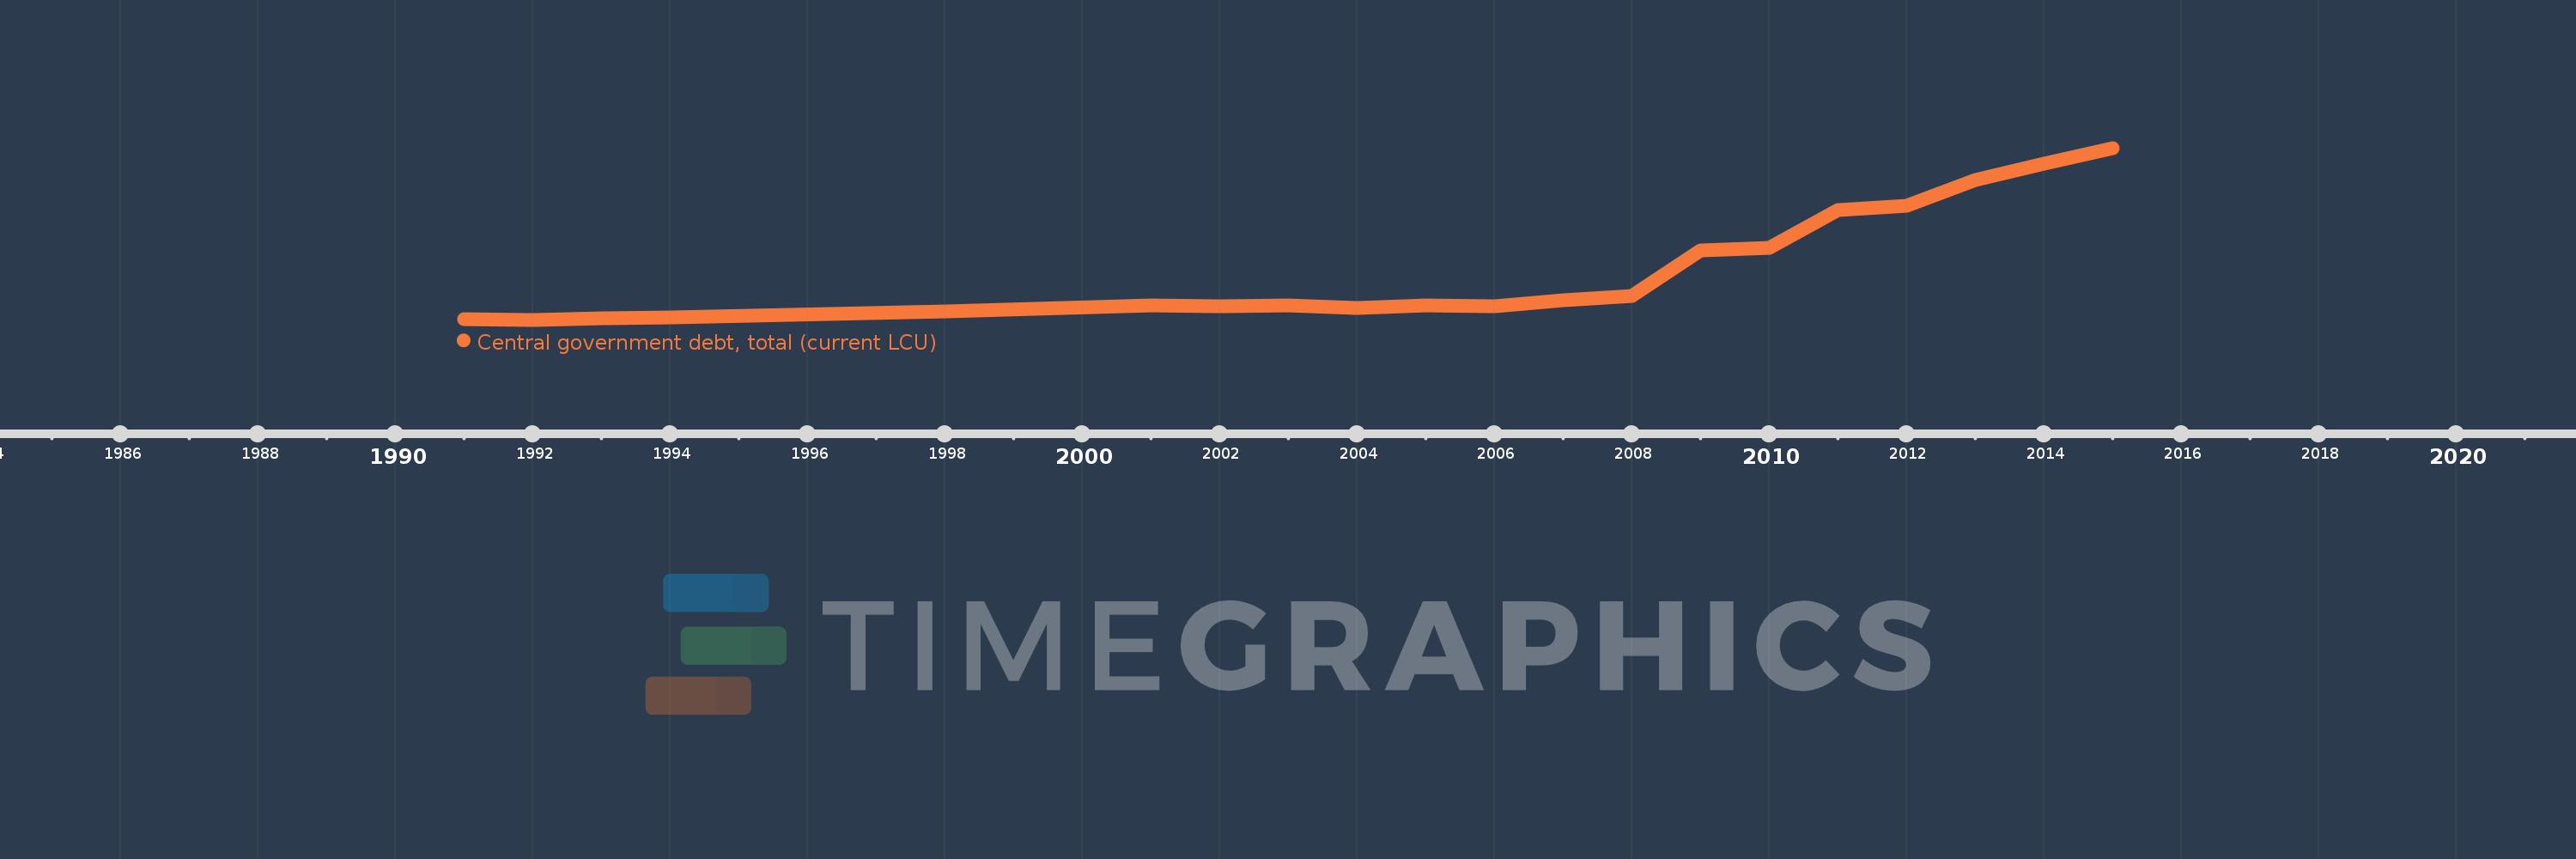
Questa scala temporale mostra un grafico dal 1991 anno al 2015 anno. Luxembourg. I dati fino ad 1990 anno non disponibili. Il numero di osservazioni attuali secondo i date: 20.
La fonte (nome):
Indicatori dello sviluppo mondiale
La fonte (organizzazione):
International Monetary Fund, Government Finance Statistics Yearbook and data files.
Categorie:
Public Sector
sono stati aggiornati
23 apr 2017 anni
Indicatori delle variazioni dei valori per anni
In media:
3.309 Mlrd
Minima:
229.128 Mln
1 gen 1992 anni
Massimo:
11.13 Mlrd
1 gen 2015 anni
Alla data di osservazione
Valore
Variazione assoluta
La variazione rispetto al valore precedente
1 gen 1991 anni
266.783 Mln
+266.783 Mln
0.0%
1 gen 1992 anni
229.128 Mln
-37.655 Mln
-14.11%
1 gen 1993 anni
324.319 Mln
+95.191 Mln
41.54%
1 gen 1994 anni
396.258 Mln
+71.939 Mln
22.18%
1 gen 1998 anni
766.648 Mln
+370.39 Mln
93.47%
1 gen 2001 anni
1.152 Mlrd
+385.0 Mln
50.22%
1 gen 2002 anni
1.102 Mlrd
-49.866 Mln
-4.33%
1 gen 2003 anni
1.128 Mlrd
+25.881 Mln
2.35%
1 gen 2004 anni
994.292 Mln
-133.371 Mln
-11.83%
1 gen 2005 anni
1.113 Mlrd
+119.182 Mln
11.99%
1 gen 2006 anni
1.093 Mlrd
-20.67 Mln
-1.86%
1 gen 2007 anni
1.477 Mlrd
+383.951 Mln
35.13%
1 gen 2008 anni
1.721 Mlrd
+244.436 Mln
16.55%
1 gen 2009 anni
4.628 Mlrd
+2.907 Mlrd
168.91%
1 gen 2010 anni
4.799 Mlrd
+170.186 Mln
3.68%
1 gen 2011 anni
7.189 Mlrd
+2.39 Mlrd
49.81%
1 gen 2012 anni
7.446 Mlrd
+257.128 Mln
3.58%
1 gen 2013 anni
9.099 Mlrd
+1.653 Mlrd
22.2%
1 gen 2014 anni
10.119 Mlrd
+1.021 Mlrd
11.22%
1 gen 2015 anni
11.13 Mlrd
+1.011 Mlrd
9.99%
Classificazione dei paesi secondo i statistiche attuali per anni
