29
/it/
it
AIzaSyAYiBZKx7MnpbEhh9jyipgxe19OcubqV5w
April 1, 2024
82071
Belgium
BEL
true
2
1
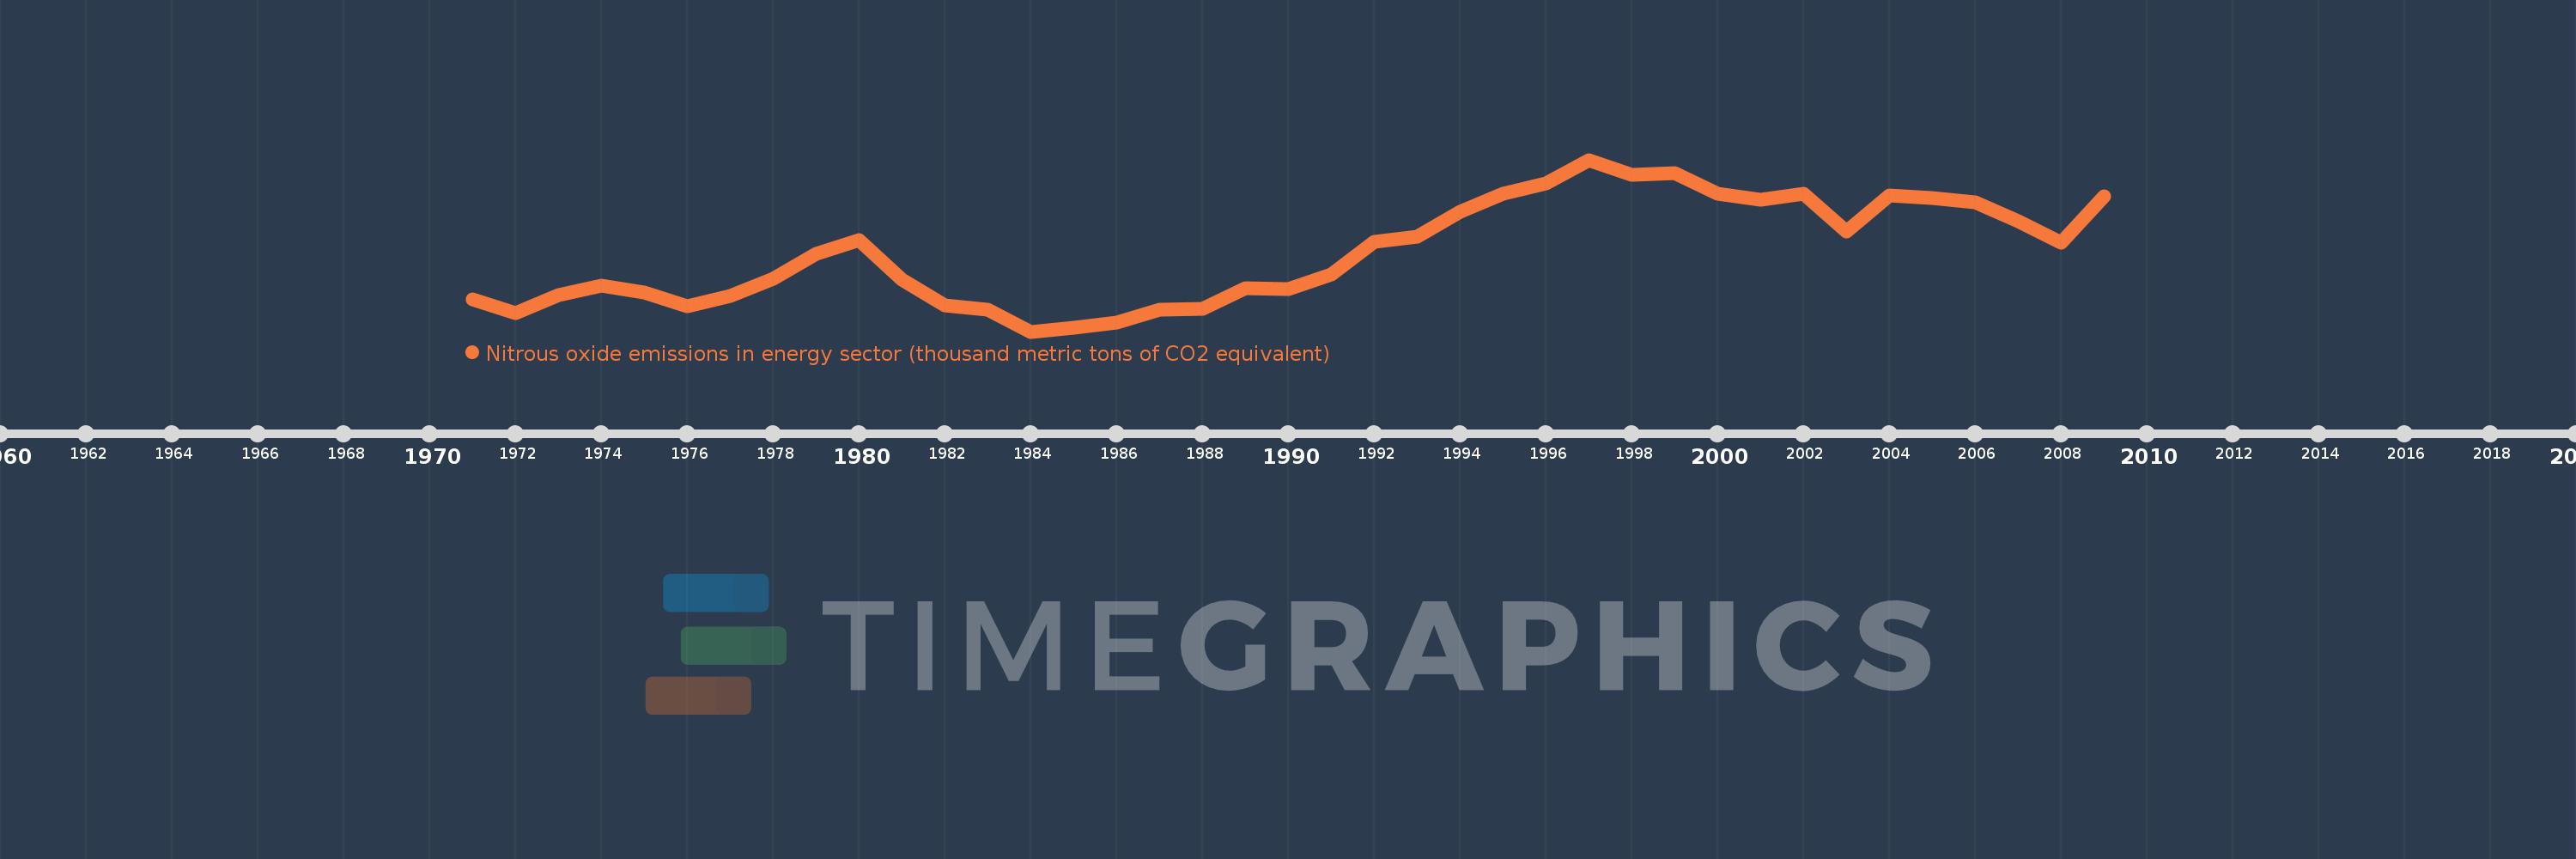
Nitrous oxide emissions in energy sector (thousand metric tons of CO2 equivalent)
2009,2008,2007,2006,2005,2004,2003,2002,2001,2000,1999,1998,1997,1996,1995,1994,1993,1992,1991,1990,1989,1988,1987,1986,1985,1984,1983,1982,1981,1980,1979,1978,1977,1976,1975,1974,1973,1972,1971
Queste statistiche in altri paesi:
AfghanistanAlbaniaAlgeriaAmerican SamoaAndorraAngolaAntigua and BarbudaArab WorldArgentinaArmeniaArubaAustraliaAustriaAzerbaijanBahamas, TheBahrainBangladeshBarbadosBelarusBelgiumBelizeBeninBermudaBhutanBoliviaBosnia and HerzegovinaBotswanaBrazilBritish Virgin IslandsBrunei DarussalamBulgariaBurkina FasoBurundiCabo VerdeCambodiaCameroonCanadaCaribbean small statesCayman IslandsCentral African RepublicCentral Europe and the BalticsChadChannel IslandsChileChinaColombiaComorosCongo, Dem. Rep.Congo, Rep.Costa RicaCote d'IvoireCroatiaCubaCuracaoCyprusCzech RepublicDenmarkDjiboutiDominicaDominican RepublicEarly-demographic dividendEast Asia & PacificEast Asia & Pacific (excluding high income)East Asia & Pacific (IDA & IBRD countries)EcuadorEgypt, Arab Rep.El SalvadorEquatorial GuineaEritreaEstoniaEthiopiaEuro areaEurope & Central AsiaEurope & Central Asia (excluding high income)Europe & Central Asia (IDA & IBRD countries)European UnionFaroe IslandsFijiFinlandFragile and conflict affected situationsFranceFrench PolynesiaGabonGambia, TheGeorgiaGermanyGhanaGibraltarGreeceGreenlandGrenadaGuamGuatemalaGuineaGuinea-BissauGuyanaHaitiHeavily indebted poor countries (HIPC)High incomeHondurasHong Kong SAR, ChinaHungaryIBRD onlyIcelandIDA & IBRD totalIDA blendIDA onlyIDA totalIndiaIndonesiaIran, Islamic Rep.IraqIrelandIsle of ManIsraelItalyJamaicaJapanJordanKazakhstanKenyaKiribatiKorea, Dem. People’s Rep.Korea, Rep.KosovoKuwaitKyrgyz RepublicLao PDRLate-demographic dividendLatin America & Caribbean Latin America & Caribbean (excluding high income)Latin America & the Caribbean (IDA & IBRD countries)LatviaLeast developed countries: UN classificationLebanonLesothoLiberiaLibyaLiechtensteinLithuaniaLow & middle incomeLow incomeLower middle incomeLuxembourgMacao SAR, ChinaMacedonia, FYRMadagascarMalawiMalaysiaMaldivesMaliMaltaMarshall IslandsMauritaniaMauritiusMexicoMicronesia, Fed. Sts.Middle East & North AfricaMiddle East & North Africa (excluding high income)Middle East & North Africa (IDA & IBRD countries)Middle incomeMoldovaMonacoMongoliaMontenegroMoroccoMozambiqueMyanmarNamibiaNauruNepalNetherlandsNew CaledoniaNew ZealandNicaraguaNigerNigeriaNorth AmericaNorthern Mariana IslandsNorwayOECD membersOmanOther small statesPacific island small statesPakistanPalauPanamaPapua New GuineaParaguayPeruPhilippinesPolandPortugalPost-demographic dividendPre-demographic dividendPuerto RicoQatarRomaniaRussian FederationRwandaSamoaSan MarinoSao Tome and PrincipeSaudi ArabiaSenegalSerbiaSeychellesSierra LeoneSingaporeSint Maarten (Dutch part)Slovak RepublicSloveniaSmall statesSolomon IslandsSomaliaSouth AfricaSouth AsiaSouth Asia (IDA & IBRD)South SudanSpainSri LankaSt. Kitts and NevisSt. LuciaSt. Martin (French part)St. Vincent and the GrenadinesSub-Saharan Africa Sub-Saharan Africa (excluding high income)Sub-Saharan Africa (IDA & IBRD countries)SudanSurinameSwazilandSwedenSwitzerlandSyrian Arab RepublicTajikistanTanzaniaThailandTimor-LesteTogoTongaTrinidad and TobagoTunisiaTurkeyTurkmenistanTurks and Caicos IslandsTuvaluUgandaUkraineUnited Arab EmiratesUnited KingdomUnited StatesUpper middle incomeUruguayUzbekistanVanuatuVenezuela, RBVietnamVirgin Islands (U.S.)West Bank and GazaWorldYemen, Rep.ZambiaZimbabwe Linea del tempo:
Questa scala temporale mostra un grafico dal 1971 anno al 2009 anno. Belgium. I dati fino ad 1970 anno non disponibili. Il numero di osservazioni attuali secondo i date: 39.
La fonte (nome):
Indicatori dello sviluppo mondiale
La fonte (organizzazione):
European Commission, Joint Research Centre (JRC)/Netherlands Environmental Assessment Agency (PBL). Emission Database for Global Atmospheric Research (EDGAR): http://edgar.jrc.ec.europa.eu/
Categorie:
Energy & Mining, Environment
sono stati aggiornati
23 apr 2017 anni
Indicatori delle variazioni dei valori per anni
Minima:
492.195
1 gen 1984 anni
Massimo:
774.488
1 gen 1997 anni
Alla data di osservazione
Valore
Variazione assoluta
La variazione rispetto al valore precedente
1 gen 1971 anni
545.664
+545.664
0.0%
1 gen 1972 anni
521.908
-23.756
-4.35%
1 gen 1973 anni
551.749
+29.841
5.72%
1 gen 1974 anni
567.46
+15.712
2.85%
1 gen 1975 anni
555.806
-11.655
-2.05%
1 gen 1976 anni
533.362
-22.444
-4.04%
1 gen 1977 anni
550.408
+17.046
3.2%
1 gen 1978 anni
578.39
+27.982
5.08%
1 gen 1979 anni
619.678
+41.288
7.14%
1 gen 1980 anni
643.116
+23.438
3.78%
1 gen 1981 anni
577.295
-65.821
-10.23%
1 gen 1982 anni
534.87
-42.425
-7.35%
1 gen 1983 anni
528.462
-6.408
-1.2%
1 gen 1984 anni
492.195
-36.267
-6.86%
1 gen 1985 anni
498.581
+6.386
1.3%
1 gen 1986 anni
506.978
+8.398
1.68%
1 gen 1987 anni
528.829
+21.85
4.31%
1 gen 1988 anni
529.128
+0.299
0.06%
1 gen 1989 anni
563.12
+33.992
6.42%
1 gen 1990 anni
561.93
-1.189
-0.21%
1 gen 1991 anni
586.071
+24.14
4.3%
1 gen 1992 anni
639.079
+53.008
9.04%
1 gen 1993 anni
648.62
+9.541
1.49%
1 gen 1994 anni
688.411
+39.791
6.13%
1 gen 1995 anni
718.871
+30.46
4.42%
1 gen 1996 anni
736.049
+17.177
2.39%
1 gen 1997 anni
774.488
+38.439
5.22%
1 gen 1998 anni
750.461
-24.027
-3.1%
1 gen 1999 anni
753.133
+2.672
0.36%
1 gen 2000 anni
718.231
-34.902
-4.63%
1 gen 2001 anni
708.373
-9.858
-1.37%
1 gen 2002 anni
718.754
+10.381
1.47%
1 gen 2003 anni
656.397
-62.357
-8.68%
1 gen 2004 anni
715.364
+58.966
8.98%
1 gen 2005 anni
711.606
-3.757
-0.53%
1 gen 2006 anni
704.366
-7.24
-1.02%
1 gen 2007 anni
672.916
-31.45
-4.47%
1 gen 2008 anni
638.481
-34.435
-5.12%
1 gen 2009 anni
714.082
+75.601
11.84%
Classificazione dei paesi secondo i statistiche attuali per anni


Commenti: