29
/it/
it
AIzaSyAYiBZKx7MnpbEhh9jyipgxe19OcubqV5w
April 1, 2024
72431
Aruba
ABW
true
2
1
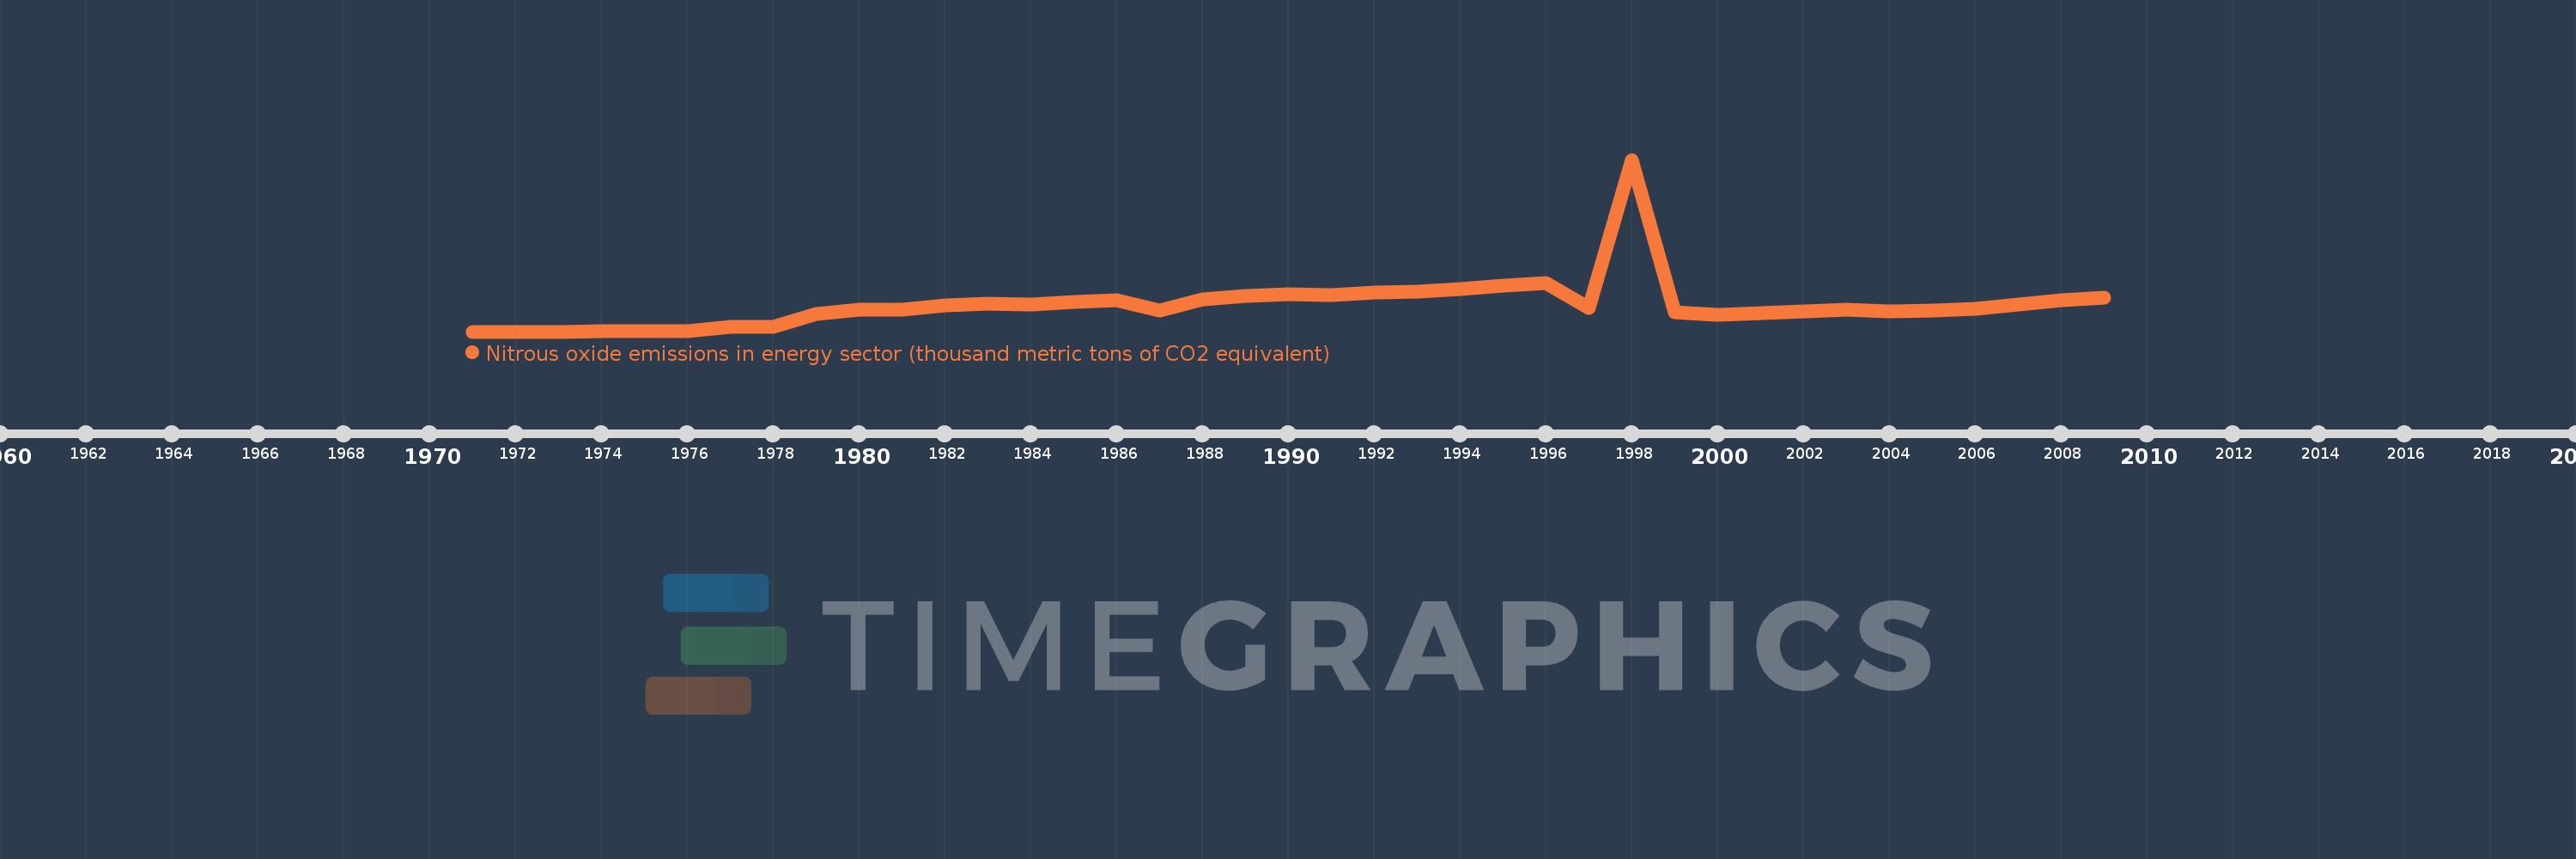
Nitrous oxide emissions in energy sector (thousand metric tons of CO2 equivalent)
2009,2008,2007,2006,2005,2004,2003,2002,2001,2000,1999,1998,1997,1996,1995,1994,1993,1992,1991,1990,1989,1988,1987,1986,1985,1984,1983,1982,1981,1980,1979,1978,1977,1976,1975,1974,1973,1972,1971
Queste statistiche in altri paesi:
AfghanistanAlbaniaAlgeriaAmerican SamoaAndorraAngolaAntigua and BarbudaArab WorldArgentinaArmeniaArubaAustraliaAustriaAzerbaijanBahamas, TheBahrainBangladeshBarbadosBelarusBelgiumBelizeBeninBermudaBhutanBoliviaBosnia and HerzegovinaBotswanaBrazilBritish Virgin IslandsBrunei DarussalamBulgariaBurkina FasoBurundiCabo VerdeCambodiaCameroonCanadaCaribbean small statesCayman IslandsCentral African RepublicCentral Europe and the BalticsChadChannel IslandsChileChinaColombiaComorosCongo, Dem. Rep.Congo, Rep.Costa RicaCote d'IvoireCroatiaCubaCuracaoCyprusCzech RepublicDenmarkDjiboutiDominicaDominican RepublicEarly-demographic dividendEast Asia & PacificEast Asia & Pacific (excluding high income)East Asia & Pacific (IDA & IBRD countries)EcuadorEgypt, Arab Rep.El SalvadorEquatorial GuineaEritreaEstoniaEthiopiaEuro areaEurope & Central AsiaEurope & Central Asia (excluding high income)Europe & Central Asia (IDA & IBRD countries)European UnionFaroe IslandsFijiFinlandFragile and conflict affected situationsFranceFrench PolynesiaGabonGambia, TheGeorgiaGermanyGhanaGibraltarGreeceGreenlandGrenadaGuamGuatemalaGuineaGuinea-BissauGuyanaHaitiHeavily indebted poor countries (HIPC)High incomeHondurasHong Kong SAR, ChinaHungaryIBRD onlyIcelandIDA & IBRD totalIDA blendIDA onlyIDA totalIndiaIndonesiaIran, Islamic Rep.IraqIrelandIsle of ManIsraelItalyJamaicaJapanJordanKazakhstanKenyaKiribatiKorea, Dem. People’s Rep.Korea, Rep.KosovoKuwaitKyrgyz RepublicLao PDRLate-demographic dividendLatin America & Caribbean Latin America & Caribbean (excluding high income)Latin America & the Caribbean (IDA & IBRD countries)LatviaLeast developed countries: UN classificationLebanonLesothoLiberiaLibyaLiechtensteinLithuaniaLow & middle incomeLow incomeLower middle incomeLuxembourgMacao SAR, ChinaMacedonia, FYRMadagascarMalawiMalaysiaMaldivesMaliMaltaMarshall IslandsMauritaniaMauritiusMexicoMicronesia, Fed. Sts.Middle East & North AfricaMiddle East & North Africa (excluding high income)Middle East & North Africa (IDA & IBRD countries)Middle incomeMoldovaMonacoMongoliaMontenegroMoroccoMozambiqueMyanmarNamibiaNauruNepalNetherlandsNew CaledoniaNew ZealandNicaraguaNigerNigeriaNorth AmericaNorthern Mariana IslandsNorwayOECD membersOmanOther small statesPacific island small statesPakistanPalauPanamaPapua New GuineaParaguayPeruPhilippinesPolandPortugalPost-demographic dividendPre-demographic dividendPuerto RicoQatarRomaniaRussian FederationRwandaSamoaSan MarinoSao Tome and PrincipeSaudi ArabiaSenegalSerbiaSeychellesSierra LeoneSingaporeSint Maarten (Dutch part)Slovak RepublicSloveniaSmall statesSolomon IslandsSomaliaSouth AfricaSouth AsiaSouth Asia (IDA & IBRD)South SudanSpainSri LankaSt. Kitts and NevisSt. LuciaSt. Martin (French part)St. Vincent and the GrenadinesSub-Saharan Africa Sub-Saharan Africa (excluding high income)Sub-Saharan Africa (IDA & IBRD countries)SudanSurinameSwazilandSwedenSwitzerlandSyrian Arab RepublicTajikistanTanzaniaThailandTimor-LesteTogoTongaTrinidad and TobagoTunisiaTurkeyTurkmenistanTurks and Caicos IslandsTuvaluUgandaUkraineUnited Arab EmiratesUnited KingdomUnited StatesUpper middle incomeUruguayUzbekistanVanuatuVenezuela, RBVietnamVirgin Islands (U.S.)West Bank and GazaWorldYemen, Rep.ZambiaZimbabwe Linea del tempo:
Questa scala temporale mostra un grafico dal 1971 anno al 2009 anno. Aruba. I dati fino ad 1970 anno non disponibili. Il numero di osservazioni attuali secondo i date: 39.
La fonte (nome):
Indicatori dello sviluppo mondiale
La fonte (organizzazione):
European Commission, Joint Research Centre (JRC)/Netherlands Environmental Assessment Agency (PBL). Emission Database for Global Atmospheric Research (EDGAR): http://edgar.jrc.ec.europa.eu/
Categorie:
Energy & Mining, Environment
sono stati aggiornati
23 apr 2017 anni
Indicatori delle variazioni dei valori per anni
Minima:
0.368
1 gen 1972 anni
Massimo:
9.496
1 gen 1998 anni
Alla data di osservazione
Valore
Variazione assoluta
La variazione rispetto al valore precedente
1 gen 1971 anni
0.368
+0.368
0.0%
1 gen 1972 anni
0.368
0.0
-0.02%
1 gen 1973 anni
0.368
+0.0
0.0%
1 gen 1974 anni
0.377
+0.009
2.44%
1 gen 1975 anni
0.375
-0.002
-0.55%
1 gen 1976 anni
0.376
+0.001
0.26%
1 gen 1977 anni
0.597
+0.222
58.99%
1 gen 1978 anni
0.601
+0.004
0.61%
1 gen 1979 anni
1.303
+0.703
116.97%
1 gen 1980 anni
1.532
+0.229
17.56%
1 gen 1981 anni
1.526
-0.007
-0.43%
1 gen 1982 anni
1.739
+0.213
13.98%
1 gen 1983 anni
1.861
+0.123
7.05%
1 gen 1984 anni
1.811
-0.05
-2.69%
1 gen 1985 anni
1.946
+0.135
7.44%
1 gen 1986 anni
2.054
+0.108
5.54%
1 gen 1987 anni
1.498
-0.556
-27.06%
1 gen 1988 anni
2.091
+0.593
39.57%
1 gen 1989 anni
2.243
+0.152
7.28%
1 gen 1990 anni
2.364
+0.12
5.37%
1 gen 1991 anni
2.294
-0.07
-2.96%
1 gen 1992 anni
2.439
+0.146
6.36%
1 gen 1993 anni
2.509
+0.07
2.87%
1 gen 1994 anni
2.634
+0.124
4.96%
1 gen 1995 anni
2.809
+0.175
6.63%
1 gen 1996 anni
2.943
+0.135
4.79%
1 gen 1997 anni
1.635
-1.308
-44.46%
1 gen 1998 anni
9.496
+7.862
480.95%
1 gen 1999 anni
1.388
-8.108
-85.38%
1 gen 2000 anni
1.257
-0.132
-9.48%
1 gen 2001 anni
1.329
+0.073
5.79%
1 gen 2002 anni
1.439
+0.109
8.23%
1 gen 2003 anni
1.518
+0.08
5.53%
1 gen 2004 anni
1.45
-0.068
-4.49%
1 gen 2005 anni
1.492
+0.042
2.91%
1 gen 2006 anni
1.587
+0.095
6.37%
1 gen 2007 anni
1.825
+0.238
15.01%
1 gen 2008 anni
2.054
+0.228
12.5%
1 gen 2009 anni
2.148
+0.095
4.6%
Classificazione dei paesi secondo i statistiche attuali per anni


Commenti: