29
/it/
it
AIzaSyAYiBZKx7MnpbEhh9jyipgxe19OcubqV5w
April 1, 2024
100335
Cameroon
CMR
true
2
1
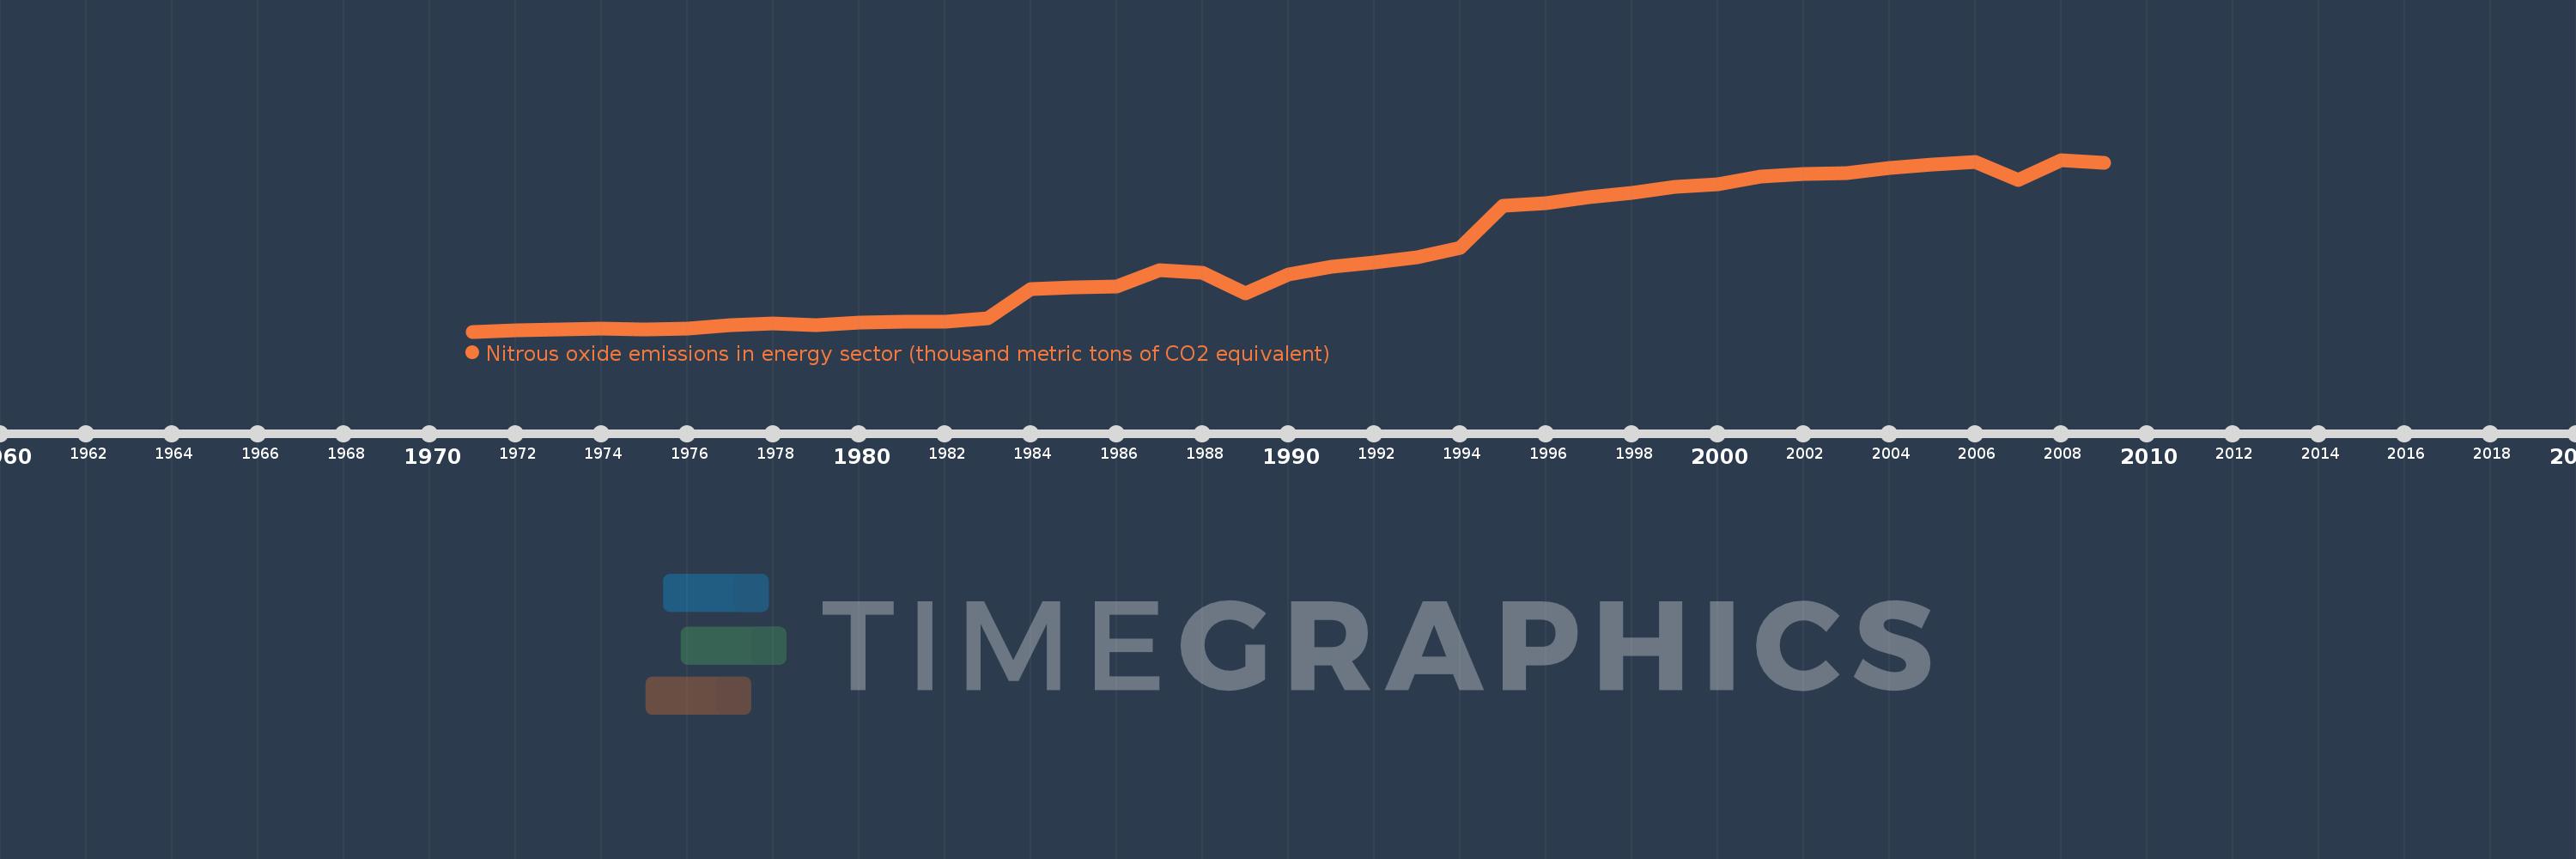
Nitrous oxide emissions in energy sector (thousand metric tons of CO2 equivalent)
2009,2008,2007,2006,2005,2004,2003,2002,2001,2000,1999,1998,1997,1996,1995,1994,1993,1992,1991,1990,1989,1988,1987,1986,1985,1984,1983,1982,1981,1980,1979,1978,1977,1976,1975,1974,1973,1972,1971
Queste statistiche in altri paesi:
AfghanistanAlbaniaAlgeriaAmerican SamoaAndorraAngolaAntigua and BarbudaArab WorldArgentinaArmeniaArubaAustraliaAustriaAzerbaijanBahamas, TheBahrainBangladeshBarbadosBelarusBelgiumBelizeBeninBermudaBhutanBoliviaBosnia and HerzegovinaBotswanaBrazilBritish Virgin IslandsBrunei DarussalamBulgariaBurkina FasoBurundiCabo VerdeCambodiaCameroonCanadaCaribbean small statesCayman IslandsCentral African RepublicCentral Europe and the BalticsChadChannel IslandsChileChinaColombiaComorosCongo, Dem. Rep.Congo, Rep.Costa RicaCote d'IvoireCroatiaCubaCuracaoCyprusCzech RepublicDenmarkDjiboutiDominicaDominican RepublicEarly-demographic dividendEast Asia & PacificEast Asia & Pacific (excluding high income)East Asia & Pacific (IDA & IBRD countries)EcuadorEgypt, Arab Rep.El SalvadorEquatorial GuineaEritreaEstoniaEthiopiaEuro areaEurope & Central AsiaEurope & Central Asia (excluding high income)Europe & Central Asia (IDA & IBRD countries)European UnionFaroe IslandsFijiFinlandFragile and conflict affected situationsFranceFrench PolynesiaGabonGambia, TheGeorgiaGermanyGhanaGibraltarGreeceGreenlandGrenadaGuamGuatemalaGuineaGuinea-BissauGuyanaHaitiHeavily indebted poor countries (HIPC)High incomeHondurasHong Kong SAR, ChinaHungaryIBRD onlyIcelandIDA & IBRD totalIDA blendIDA onlyIDA totalIndiaIndonesiaIran, Islamic Rep.IraqIrelandIsle of ManIsraelItalyJamaicaJapanJordanKazakhstanKenyaKiribatiKorea, Dem. People’s Rep.Korea, Rep.KosovoKuwaitKyrgyz RepublicLao PDRLate-demographic dividendLatin America & Caribbean Latin America & Caribbean (excluding high income)Latin America & the Caribbean (IDA & IBRD countries)LatviaLeast developed countries: UN classificationLebanonLesothoLiberiaLibyaLiechtensteinLithuaniaLow & middle incomeLow incomeLower middle incomeLuxembourgMacao SAR, ChinaMacedonia, FYRMadagascarMalawiMalaysiaMaldivesMaliMaltaMarshall IslandsMauritaniaMauritiusMexicoMicronesia, Fed. Sts.Middle East & North AfricaMiddle East & North Africa (excluding high income)Middle East & North Africa (IDA & IBRD countries)Middle incomeMoldovaMonacoMongoliaMontenegroMoroccoMozambiqueMyanmarNamibiaNauruNepalNetherlandsNew CaledoniaNew ZealandNicaraguaNigerNigeriaNorth AmericaNorthern Mariana IslandsNorwayOECD membersOmanOther small statesPacific island small statesPakistanPalauPanamaPapua New GuineaParaguayPeruPhilippinesPolandPortugalPost-demographic dividendPre-demographic dividendPuerto RicoQatarRomaniaRussian FederationRwandaSamoaSan MarinoSao Tome and PrincipeSaudi ArabiaSenegalSerbiaSeychellesSierra LeoneSingaporeSint Maarten (Dutch part)Slovak RepublicSloveniaSmall statesSolomon IslandsSomaliaSouth AfricaSouth AsiaSouth Asia (IDA & IBRD)South SudanSpainSri LankaSt. Kitts and NevisSt. LuciaSt. Martin (French part)St. Vincent and the GrenadinesSub-Saharan Africa Sub-Saharan Africa (excluding high income)Sub-Saharan Africa (IDA & IBRD countries)SudanSurinameSwazilandSwedenSwitzerlandSyrian Arab RepublicTajikistanTanzaniaThailandTimor-LesteTogoTongaTrinidad and TobagoTunisiaTurkeyTurkmenistanTurks and Caicos IslandsTuvaluUgandaUkraineUnited Arab EmiratesUnited KingdomUnited StatesUpper middle incomeUruguayUzbekistanVanuatuVenezuela, RBVietnamVirgin Islands (U.S.)West Bank and GazaWorldYemen, Rep.ZambiaZimbabwe Linea del tempo:
Questa scala temporale mostra un grafico dal 1971 anno al 2009 anno. Cameroon. I dati fino ad 1970 anno non disponibili. Il numero di osservazioni attuali secondo i date: 39.
La fonte (nome):
Indicatori dello sviluppo mondiale
La fonte (organizzazione):
European Commission, Joint Research Centre (JRC)/Netherlands Environmental Assessment Agency (PBL). Emission Database for Global Atmospheric Research (EDGAR): http://edgar.jrc.ec.europa.eu/
Categorie:
Energy & Mining, Environment
sono stati aggiornati
23 apr 2017 anni
Indicatori delle variazioni dei valori per anni
Minima:
104.825
1 gen 1971 anni
Massimo:
238.331
1 gen 2008 anni
Alla data di osservazione
Valore
Variazione assoluta
La variazione rispetto al valore precedente
1 gen 1971 anni
104.825
+104.825
0.0%
1 gen 1972 anni
105.638
+0.814
0.78%
1 gen 1973 anni
106.444
+0.806
0.76%
1 gen 1974 anni
106.93
+0.485
0.46%
1 gen 1975 anni
106.395
-0.534
-0.5%
1 gen 1976 anni
107.031
+0.636
0.6%
1 gen 1977 anni
109.645
+2.614
2.44%
1 gen 1978 anni
110.906
+1.261
1.15%
1 gen 1979 anni
109.767
-1.14
-1.03%
1 gen 1980 anni
111.663
+1.896
1.73%
1 gen 1981 anni
112.752
+1.089
0.98%
1 gen 1982 anni
112.243
-0.509
-0.45%
1 gen 1983 anni
114.912
+2.669
2.38%
1 gen 1984 anni
138.073
+23.161
20.16%
1 gen 1985 anni
139.036
+0.963
0.7%
1 gen 1986 anni
139.636
+0.599
0.43%
1 gen 1987 anni
152.867
+13.231
9.48%
1 gen 1988 anni
150.407
-2.46
-1.61%
1 gen 1989 anni
134.626
-15.781
-10.49%
1 gen 1990 anni
149.412
+14.786
10.98%
1 gen 1991 anni
155.047
+5.635
3.77%
1 gen 1992 anni
158.692
+3.644
2.35%
1 gen 1993 anni
162.376
+3.685
2.32%
1 gen 1994 anni
169.92
+7.544
4.65%
1 gen 1995 anni
202.631
+32.711
19.25%
1 gen 1996 anni
204.897
+2.267
1.12%
1 gen 1997 anni
209.345
+4.447
2.17%
1 gen 1998 anni
212.799
+3.454
1.65%
1 gen 1999 anni
217.207
+4.408
2.07%
1 gen 2000 anni
219.504
+2.297
1.06%
1 gen 2001 anni
225.164
+5.66
2.58%
1 gen 2002 anni
227.196
+2.032
0.9%
1 gen 2003 anni
228.277
+1.081
0.48%
1 gen 2004 anni
232.028
+3.751
1.64%
1 gen 2005 anni
234.433
+2.405
1.04%
1 gen 2006 anni
236.947
+2.513
1.07%
1 gen 2007 anni
222.832
-14.114
-5.96%
1 gen 2008 anni
238.331
+15.498
6.96%
1 gen 2009 anni
235.828
-2.502
-1.05%
Classificazione dei paesi secondo i statistiche attuali per anni


Commenti: