29
/it/
it
AIzaSyAYiBZKx7MnpbEhh9jyipgxe19OcubqV5w
April 1, 2024
78650
Bangladesh
BGD
true
2
1
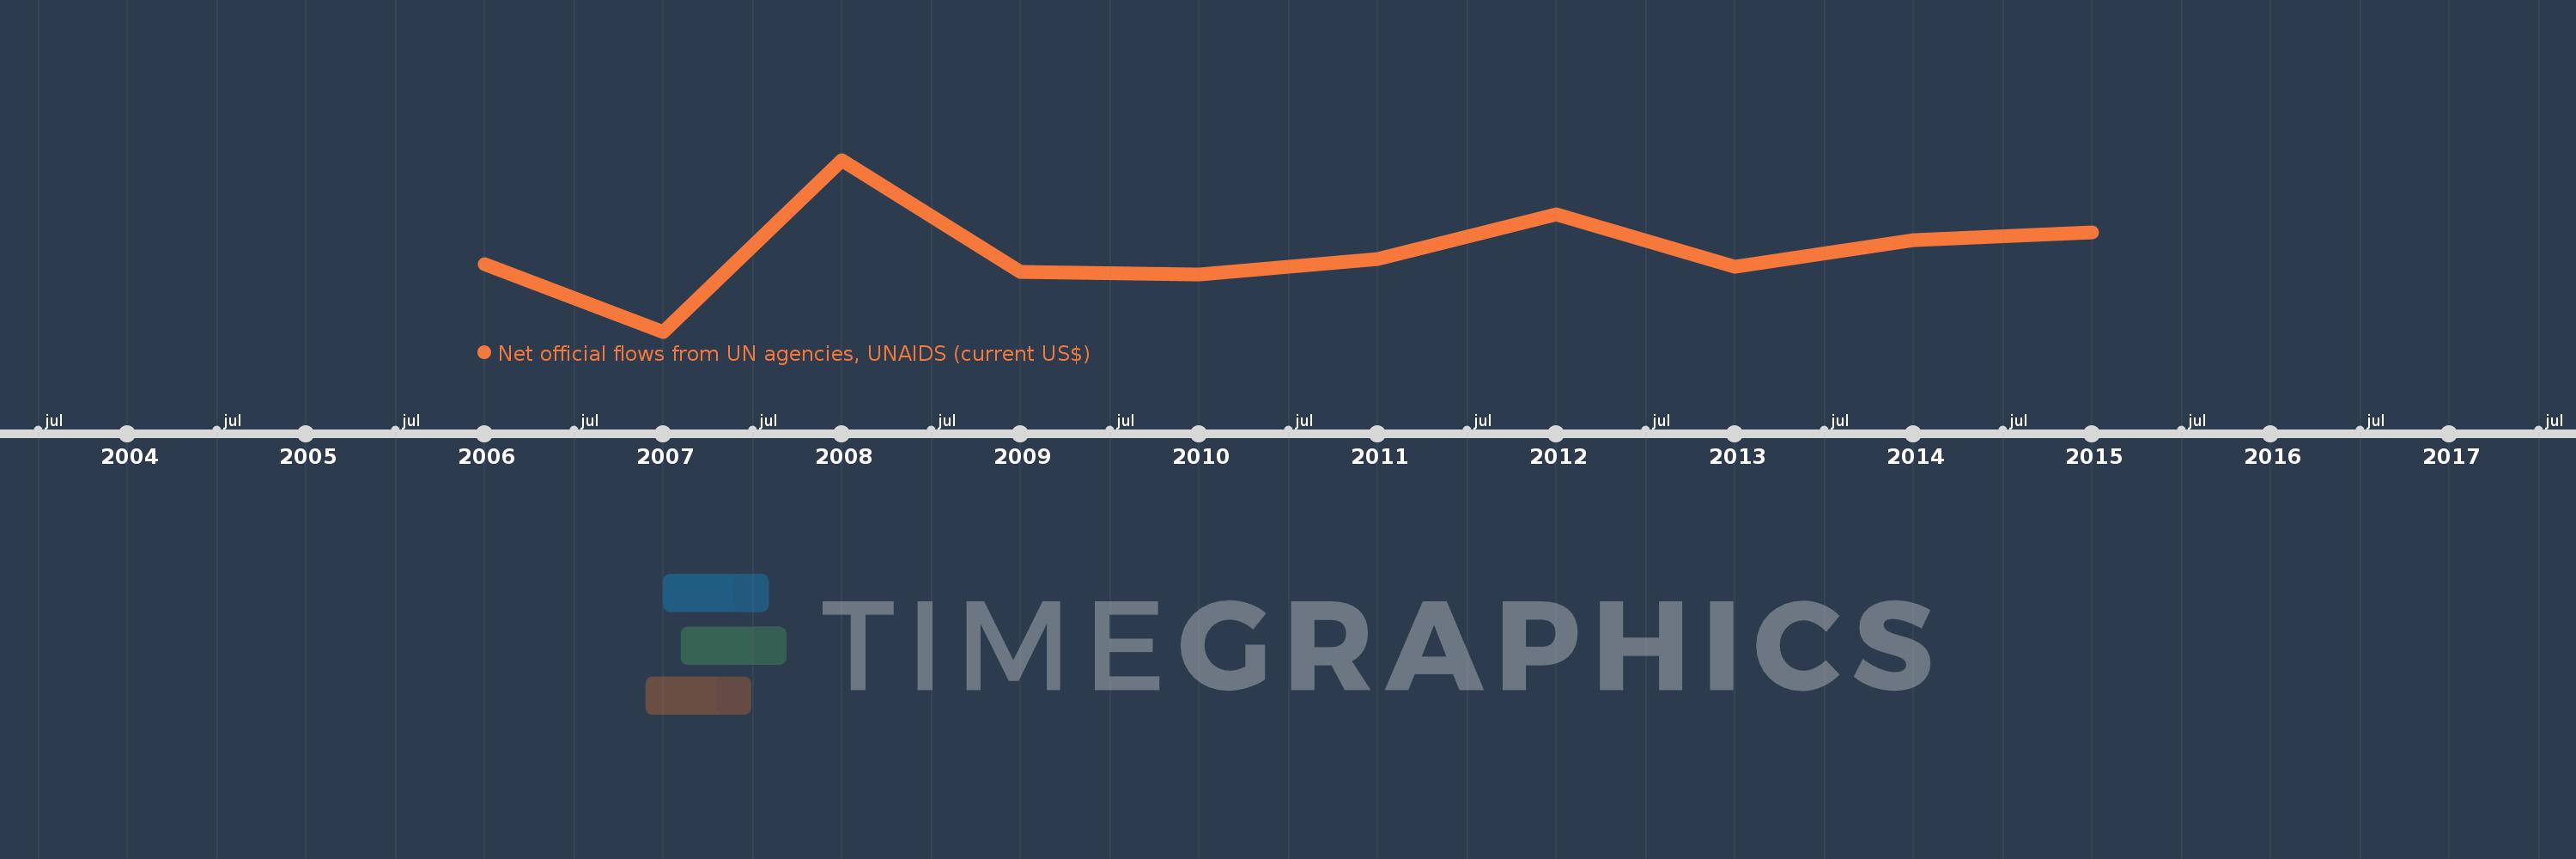
Net official flows from UN agencies, UNAIDS (current US$)
2015,2014,2013,2012,2011,2010,2009,2008,2007,2006
Queste statistiche in altri paesi:
Linea del tempo:
Questa scala temporale mostra un grafico dal 2006 anno al 2015 anno. Bangladesh. I dati fino ad 2005 anno non disponibili. Il numero di osservazioni attuali secondo i date: 10.
La fonte (nome):
Indicatori dello sviluppo mondiale
La fonte (organizzazione):
Development Assistance Committee of the Organisation for Economic Co-operation and Development, Geographical Distribution of Financial Flows to Developing Countries, Development Co-operation Report, and International Development Statistics database. Data are available online at: www.oecd.org/dac/stats/idsonline.
Categorie:
Aid Effectiveness
sono stati aggiornati
23 apr 2017 anni
Indicatori delle variazioni dei valori per anni
Minima:
140.0 Mille.
1 gen 2007 anni
Massimo:
800.0 Mille.
1 gen 2008 anni
Alla data di osservazione
Valore
Variazione assoluta
La variazione rispetto al valore precedente
1 gen 2006 anni
400.0 Mille.
+400.0 Mille.
0.0%
1 gen 2007 anni
140.0 Mille.
-260.0 Mille.
-65.0%
1 gen 2008 anni
800.0 Mille.
+660.0 Mille.
471.43%
1 gen 2009 anni
370.0 Mille.
-430.0 Mille.
-53.75%
1 gen 2010 anni
360.0 Mille.
-10.0 Mille.
-2.7%
1 gen 2011 anni
420.0 Mille.
+60.0 Mille.
16.67%
1 gen 2012 anni
590.0 Mille.
+170.0 Mille.
40.48%
1 gen 2013 anni
390.0 Mille.
-200.0 Mille.
-33.9%
1 gen 2014 anni
490.0 Mille.
+100.0 Mille.
25.64%
1 gen 2015 anni
520.0 Mille.
+30.0 Mille.
6.12%
Classificazione dei paesi secondo i statistiche attuali per anni


Commenti: