29
/it/
it
AIzaSyAYiBZKx7MnpbEhh9jyipgxe19OcubqV5w
April 1, 2024
59205
Sub-Saharan Africa
SSF
false
2
1
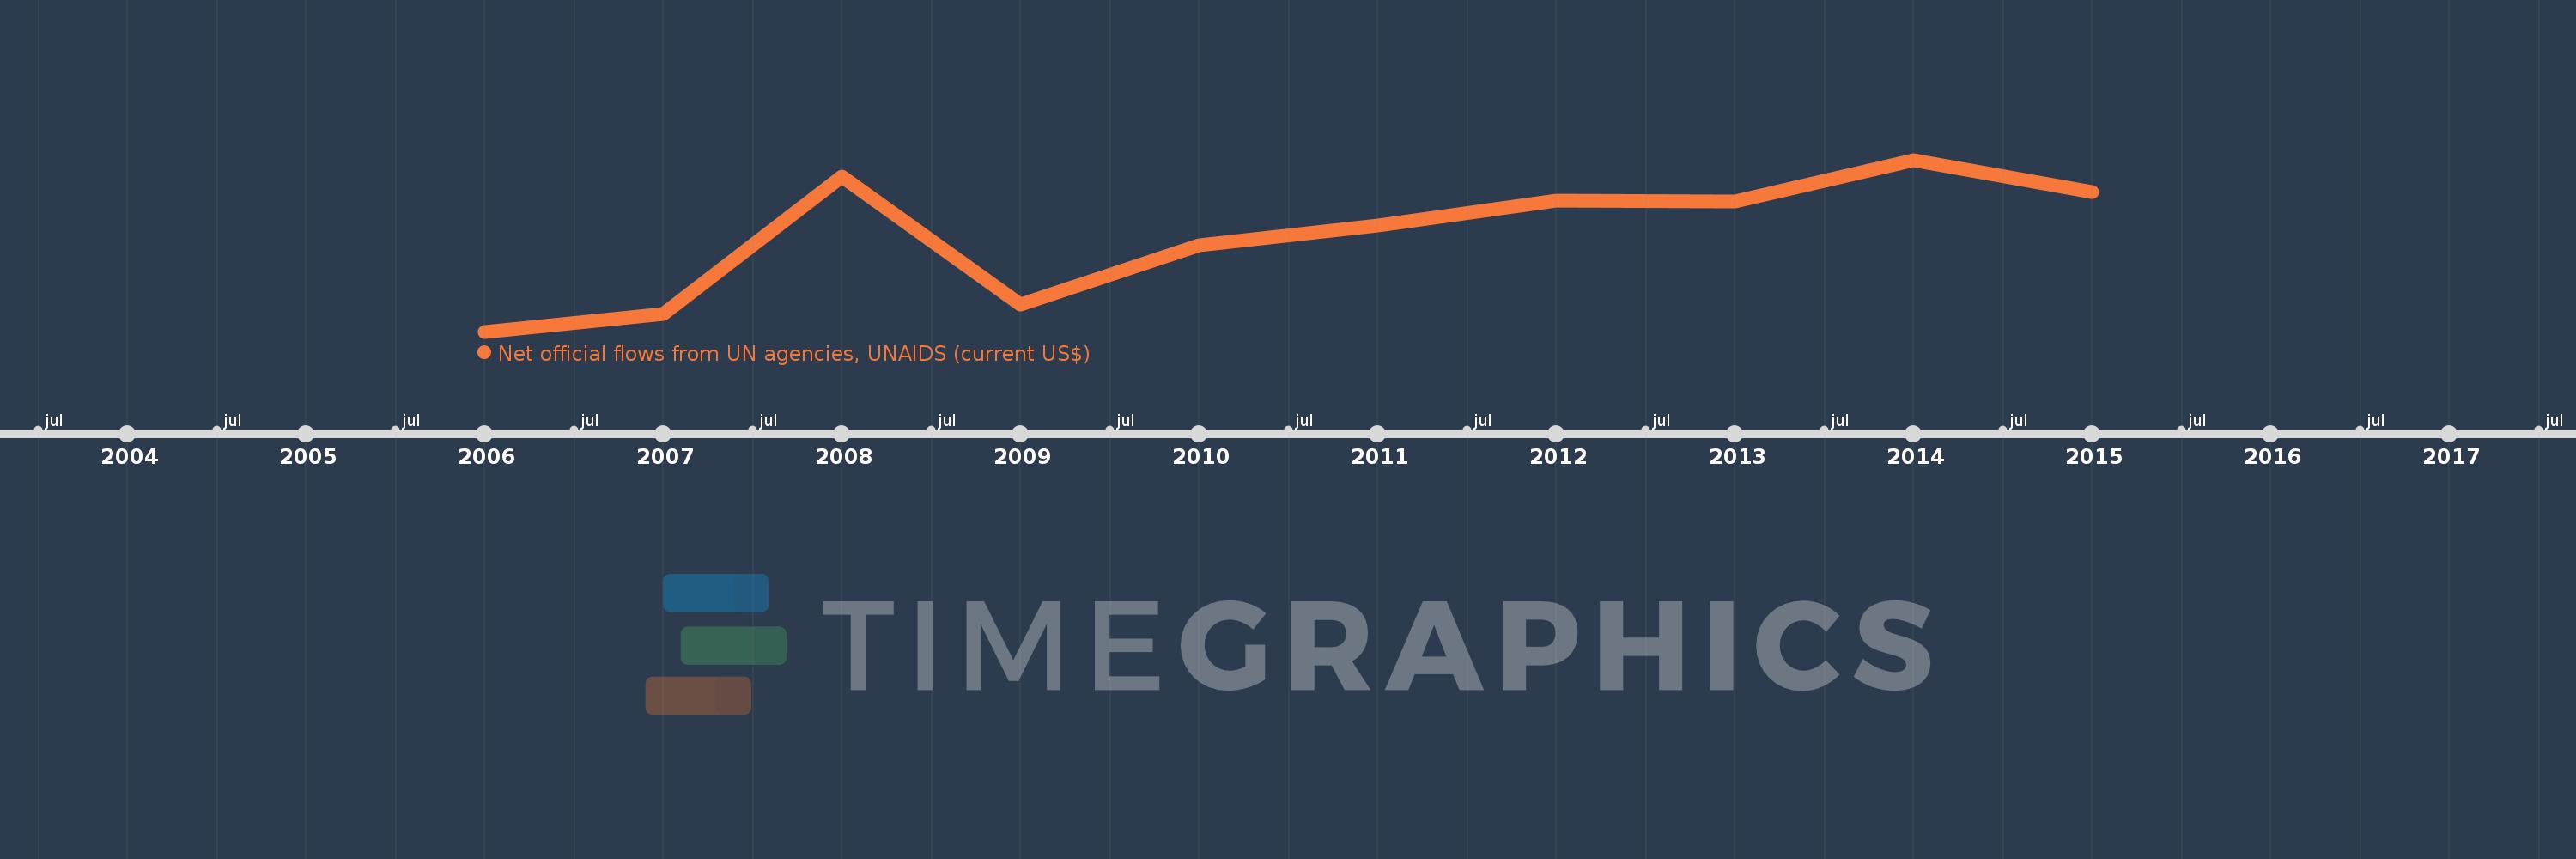
Net official flows from UN agencies, UNAIDS (current US$)
2015,2014,2013,2012,2011,2010,2009,2008,2007,2006
Queste statistiche in altri paesi:
Linea del tempo:
Questa scala temporale mostra un grafico dal 2006 anno al 2015 anno. Sub-Saharan Africa . I dati fino ad 2005 anno non disponibili. Il numero di osservazioni attuali secondo i date: 10.
La fonte (nome):
Indicatori dello sviluppo mondiale
La fonte (organizzazione):
Development Assistance Committee of the Organisation for Economic Co-operation and Development, Geographical Distribution of Financial Flows to Developing Countries, Development Co-operation Report, and International Development Statistics database. Data are available online at: www.oecd.org/dac/stats/idsonline.
Categorie:
Aid Effectiveness
sono stati aggiornati
23 apr 2017 anni
Indicatori delle variazioni dei valori per anni
Minima:
15.83 Mln
1 gen 2006 anni
Massimo:
48.69 Mln
1 gen 2014 anni
Alla data di osservazione
Valore
Variazione assoluta
La variazione rispetto al valore precedente
1 gen 2006 anni
15.83 Mln
+15.83 Mln
0.0%
1 gen 2007 anni
19.19 Mln
+3.36 Mln
21.23%
1 gen 2008 anni
45.55 Mln
+26.36 Mln
137.36%
1 gen 2009 anni
20.93 Mln
-24.62 Mln
-54.05%
1 gen 2010 anni
32.34 Mln
+11.41 Mln
54.52%
1 gen 2011 anni
36.08 Mln
+3.74 Mln
11.56%
1 gen 2012 anni
40.9 Mln
+4.82 Mln
13.36%
1 gen 2013 anni
40.75 Mln
-150.0 Mille.
-0.37%
1 gen 2014 anni
48.69 Mln
+7.94 Mln
19.48%
1 gen 2015 anni
42.49 Mln
-6.2 Mln
-12.73%
Classificazione dei paesi secondo i statistiche attuali per anni


Commenti: