29
/
en
AIzaSyAYiBZKx7MnpbEhh9jyipgxe19OcubqV5w
April 1, 2024
78650
Bangladesh
BGD
true
2
1
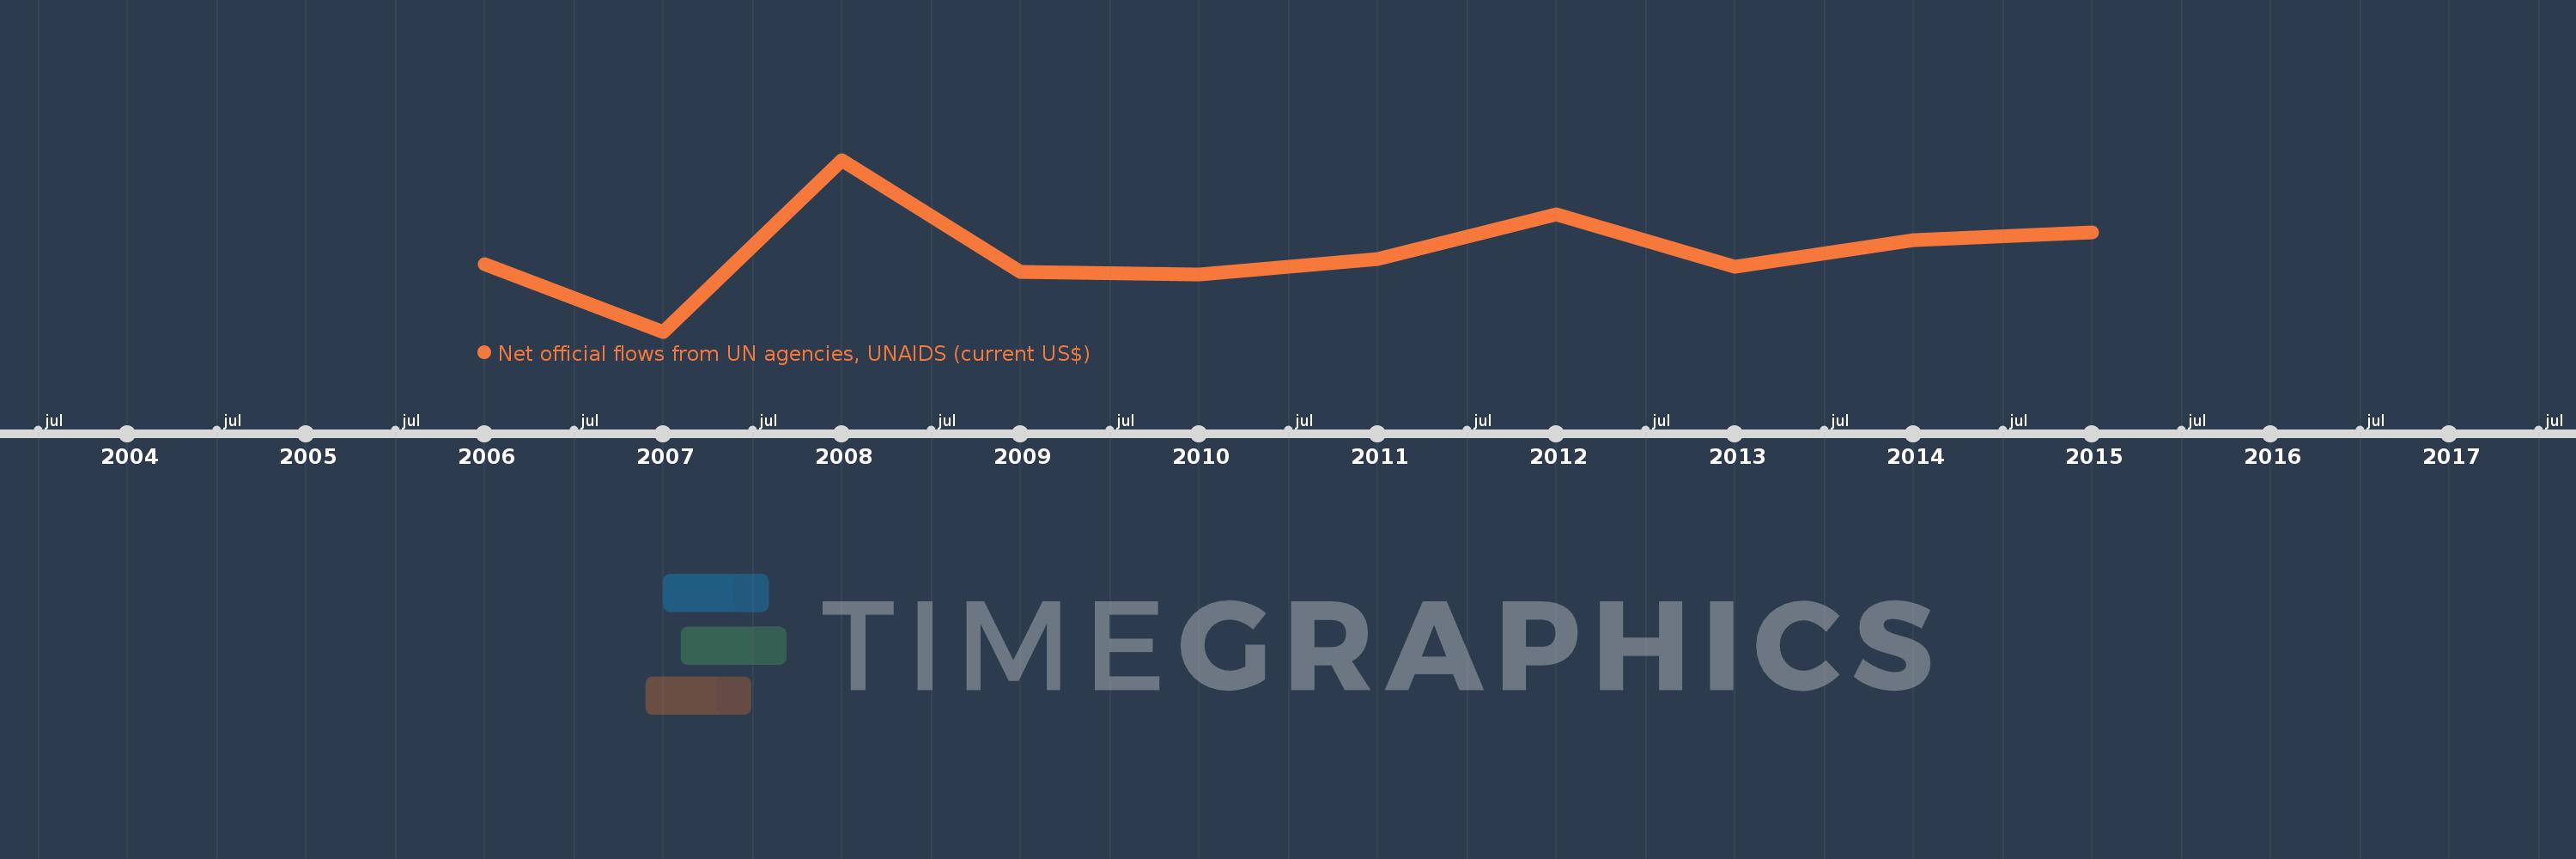
Net official flows from UN agencies, UNAIDS (current US$)
2015,2014,2013,2012,2011,2010,2009,2008,2007,2006
This statistics in other country:
Timeline:
This timeline shows a graph from 2006 to 2015 of Bangladesh. No data until 2005. Number of actual observations by date: 10.
Source name:
World Development Indicators
Source organization:
Development Assistance Committee of the Organisation for Economic Co-operation and Development, Geographical Distribution of Financial Flows to Developing Countries, Development Co-operation Report, and International Development Statistics database. Data are available online at: www.oecd.org/dac/stats/idsonline.
Categories, topics:
Aid Effectiveness
Last updated:
apr 23, 2017
Indicators value changes by year
Minimum:
140.0K
jan 1, 2007
Maximum:
800.0K
jan 1, 2008
At the date of observation
Value
Absolute change
Change from previous value
jan 1, 2006
400.0K
+400.0K
0.0%
jan 1, 2007
140.0K
-260.0K
-65.0%
jan 1, 2008
800.0K
+660.0K
471.43%
jan 1, 2009
370.0K
-430.0K
-53.75%
jan 1, 2010
360.0K
-10.0K
-2.7%
jan 1, 2011
420.0K
+60.0K
16.67%
jan 1, 2012
590.0K
+170.0K
40.48%
jan 1, 2013
390.0K
-200.0K
-33.9%
jan 1, 2014
490.0K
+100.0K
25.64%
jan 1, 2015
520.0K
+30.0K
6.12%
Ranking of countries by current statistics by years


Comments: