30
/it/
AIzaSyAYiBZKx7MnpbEhh9jyipgxe19OcubqV5w
April 1, 2024
78283
Bangladesh
BGD
true
2
1
Government expenditure per tertiary student as % of GDP per capita (%)
2012,2010,2009,2008,2007,2005,2004,2003,2002,2001,2000
Download
Biblioteca di statistiche globali →Bangladesh →

Government expenditure per tertiary student as % of GDP per capita (%)

Queste statistiche in altri paesi:

AlbaniaAndorraAngolaAntigua and BarbudaArgentinaArmeniaArubaAustraliaAustriaAzerbaijanBangladeshBarbadosBelarusBelgiumBelizeBeninBermudaBhutanBoliviaBotswanaBrazilBrunei DarussalamBulgariaBurkina FasoBurundiCabo VerdeCambodiaCameroonCanadaCaribbean small statesCentral African RepublicCentral Europe and the BalticsChadChileChinaColombiaComorosCongo, Dem. Rep.Congo, Rep.Costa RicaCote d'IvoireCroatiaCubaCuracaoCyprusCzech RepublicDenmarkDjiboutiEast Asia & PacificEast Asia & Pacific (excluding high income)East Asia & Pacific (IDA & IBRD countries)EcuadorEl SalvadorEritreaEstoniaEthiopiaEuro areaEurope & Central AsiaEurope & Central Asia (excluding high income)Europe & Central Asia (IDA & IBRD countries)European UnionFijiFinlandFranceGambia, TheGeorgiaGhanaGreeceGuatemalaGuineaGuyanaHeavily indebted poor countries (HIPC)High incomeHondurasHong Kong SAR, ChinaHungaryIBRD onlyIcelandIDA blendIndiaIndonesiaIran, Islamic Rep.IrelandIsraelItalyJamaicaJapanKazakhstanKenyaKorea, Rep.KuwaitKyrgyz RepublicLao PDRLate-demographic dividendLatin America & Caribbean Latin America & Caribbean (excluding high income)Latin America & the Caribbean (IDA & IBRD countries)LatviaLeast developed countries: UN classificationLebanonLesothoLiberiaLibyaLiechtensteinLithuaniaLow incomeMacao SAR, ChinaMacedonia, FYRMadagascarMalawiMalaysiaMaliMaltaMarshall IslandsMauritaniaMauritiusMexicoMoldovaMongoliaMoroccoMozambiqueNamibiaNepalNetherlandsNew ZealandNigerNorth AmericaNorwayOECD membersOmanOther small statesPakistanPalauPanamaParaguayPeruPhilippinesPolandPortugalPost-demographic dividendPuerto RicoRomaniaRussian FederationRwandaSamoaSan MarinoSao Tome and PrincipeSaudi ArabiaSenegalSerbiaSeychellesSingaporeSlovak RepublicSloveniaSmall statesSouth AfricaSouth AsiaSouth Asia (IDA & IBRD)SpainSri LankaSt. LuciaSwazilandSwedenSwitzerlandSyrian Arab RepublicTajikistanTanzaniaThailandTimor-LesteTogoTongaTunisiaTurkeyUgandaUkraineUnited KingdomUnited StatesUruguayVanuatuVenezuela, RBVietnamWorldZimbabwe

Linea del tempo:

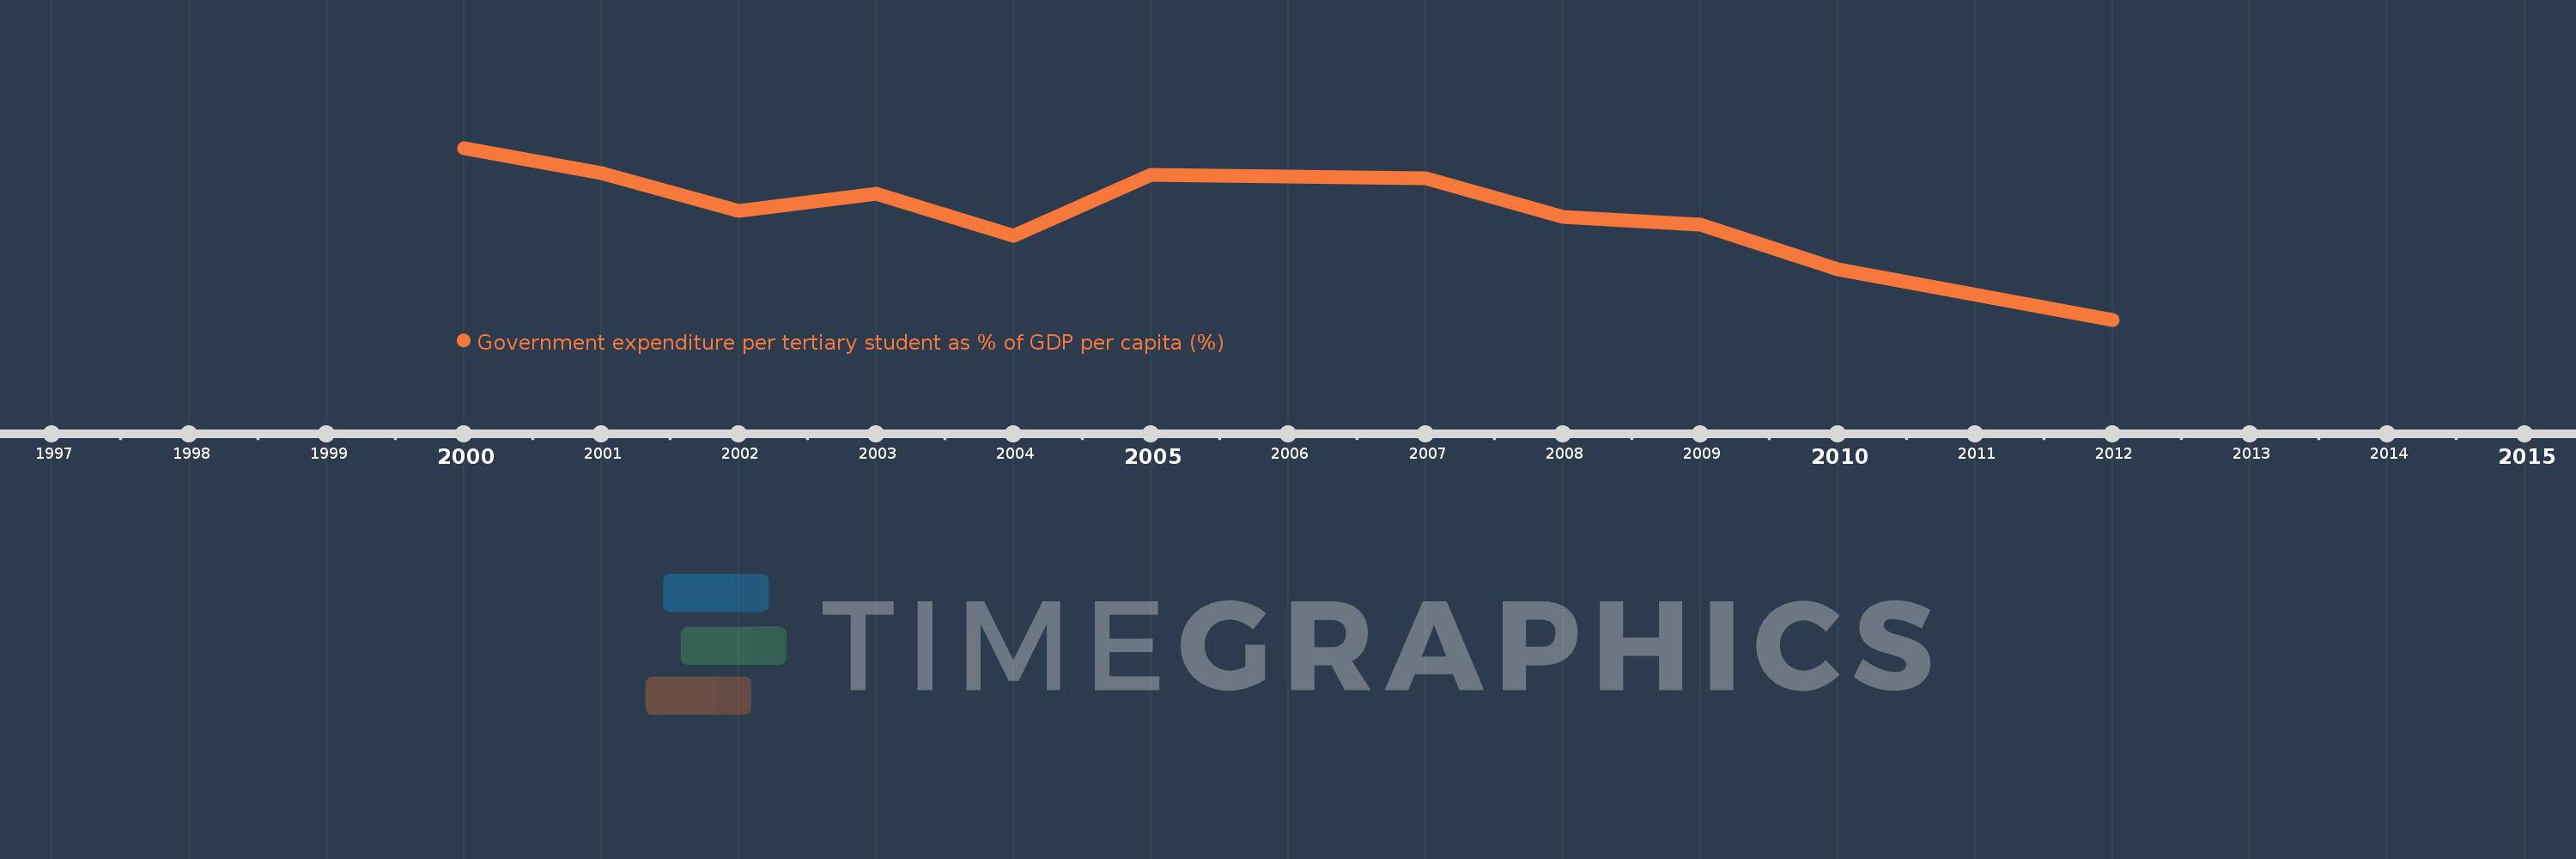
Questa scala temporale mostra un grafico dal 2000 anno al 2012 anno. Bangladesh. I dati fino ad 1999 anno non disponibili. Il numero di osservazioni attuali secondo i date: 11.

La fonte (nome):

Indicatori dello sviluppo mondiale

La fonte (organizzazione):

UNESCO Institute for Statistics

Categorie:

Education

sono stati aggiornati

23 apr 2017 anni

Indicatori delle variazioni dei valori per anni

In media:
32.443
Minima:
17.493
1 gen 2012 anni
Massimo:
41.588
1 gen 2000 anni
Alla data di osservazione
Valore
Variazione assoluta
La variazione rispetto al valore precedente
1 gen 2000 anni
41.588
+41.588
0.0%
1 gen 2001 anni
38.084
-3.504
-8.43%
1 gen 2002 anni
32.797
-5.287
-13.88%
1 gen 2003 anni
35.142
+2.345
7.15%
1 gen 2004 anni
29.273
-5.868
-16.7%
1 gen 2005 anni
37.787
+8.514
29.08%
1 gen 2007 anni
37.379
-0.408
-1.08%
1 gen 2008 anni
31.935
-5.444
-14.56%
1 gen 2009 anni
30.862
-1.073
-3.36%
1 gen 2010 anni
24.536
-6.326
-20.5%
1 gen 2012 anni
17.493
-7.043
-28.7%

Classificazione dei paesi secondo i statistiche attuali per anni