30
/it/
AIzaSyAYiBZKx7MnpbEhh9jyipgxe19OcubqV5w
April 1, 2024
262283
Thailand
THA
true
2
1
Government expenditure per tertiary student as % of GDP per capita (%)
2014,2013,2012,2011,2010,2009,2007,2006,2005,2002,2001,1999
Download
Biblioteca di statistiche globali →Thailand →

Government expenditure per tertiary student as % of GDP per capita (%)

Queste statistiche in altri paesi:

AlbaniaAndorraAngolaAntigua and BarbudaArgentinaArmeniaArubaAustraliaAustriaAzerbaijanBangladeshBarbadosBelarusBelgiumBelizeBeninBermudaBhutanBoliviaBotswanaBrazilBrunei DarussalamBulgariaBurkina FasoBurundiCabo VerdeCambodiaCameroonCanadaCaribbean small statesCentral African RepublicCentral Europe and the BalticsChadChileChinaColombiaComorosCongo, Dem. Rep.Congo, Rep.Costa RicaCote d'IvoireCroatiaCubaCuracaoCyprusCzech RepublicDenmarkDjiboutiEast Asia & PacificEast Asia & Pacific (excluding high income)East Asia & Pacific (IDA & IBRD countries)EcuadorEl SalvadorEritreaEstoniaEthiopiaEuro areaEurope & Central AsiaEurope & Central Asia (excluding high income)Europe & Central Asia (IDA & IBRD countries)European UnionFijiFinlandFranceGambia, TheGeorgiaGhanaGreeceGuatemalaGuineaGuyanaHeavily indebted poor countries (HIPC)High incomeHondurasHong Kong SAR, ChinaHungaryIBRD onlyIcelandIDA blendIndiaIndonesiaIran, Islamic Rep.IrelandIsraelItalyJamaicaJapanKazakhstanKenyaKorea, Rep.KuwaitKyrgyz RepublicLao PDRLate-demographic dividendLatin America & Caribbean Latin America & Caribbean (excluding high income)Latin America & the Caribbean (IDA & IBRD countries)LatviaLeast developed countries: UN classificationLebanonLesothoLiberiaLibyaLiechtensteinLithuaniaLow incomeMacao SAR, ChinaMacedonia, FYRMadagascarMalawiMalaysiaMaliMaltaMarshall IslandsMauritaniaMauritiusMexicoMoldovaMongoliaMoroccoMozambiqueNamibiaNepalNetherlandsNew ZealandNigerNorth AmericaNorwayOECD membersOmanOther small statesPakistanPalauPanamaParaguayPeruPhilippinesPolandPortugalPost-demographic dividendPuerto RicoRomaniaRussian FederationRwandaSamoaSan MarinoSao Tome and PrincipeSaudi ArabiaSenegalSerbiaSeychellesSingaporeSlovak RepublicSloveniaSmall statesSouth AfricaSouth AsiaSouth Asia (IDA & IBRD)SpainSri LankaSt. LuciaSwazilandSwedenSwitzerlandSyrian Arab RepublicTajikistanTanzaniaThailandTimor-LesteTogoTongaTunisiaTurkeyUgandaUkraineUnited KingdomUnited StatesUruguayVanuatuVenezuela, RBVietnamWorldZimbabwe

Linea del tempo:

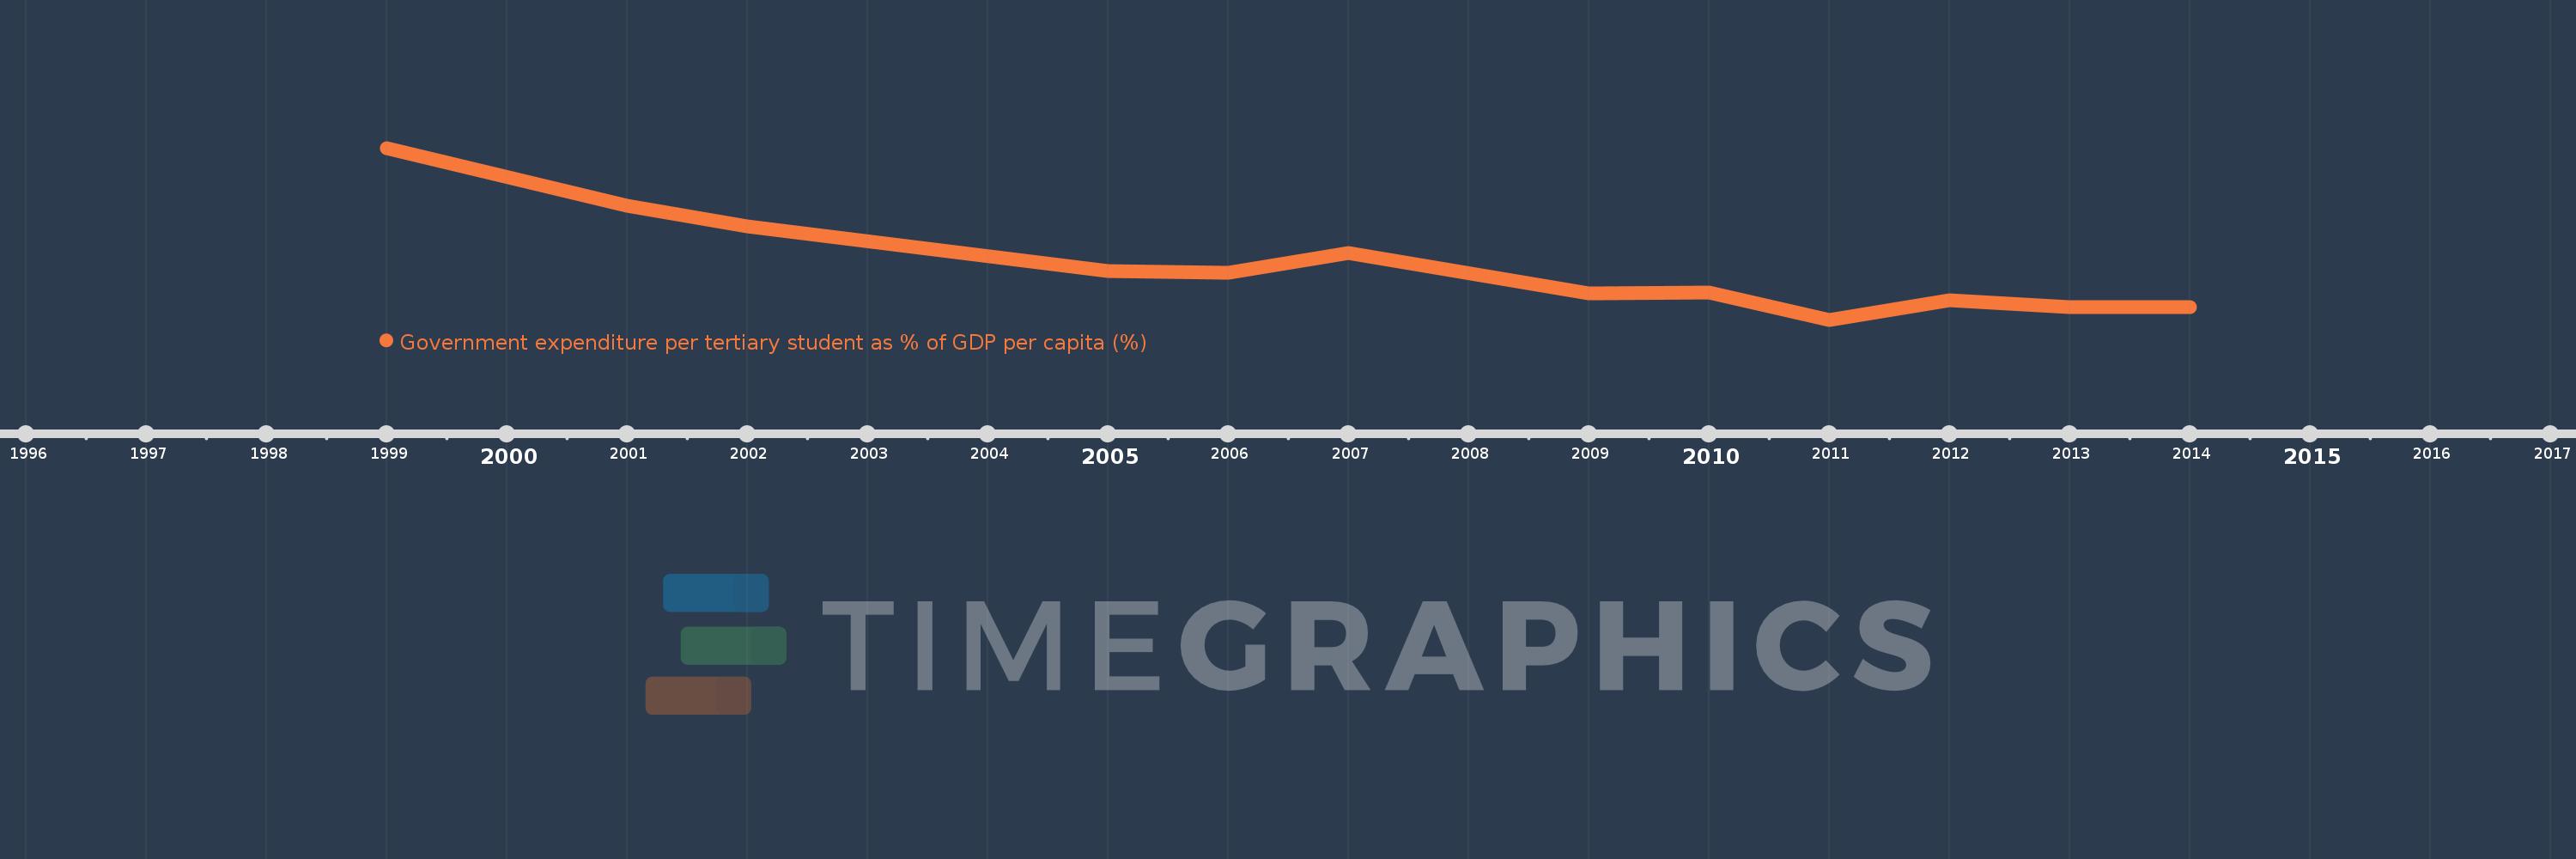
Questa scala temporale mostra un grafico dal 1999 anno al 2014 anno. Thailand. I dati fino ad 1998 anno non disponibili. Il numero di osservazioni attuali secondo i date: 12.

La fonte (nome):

Indicatori dello sviluppo mondiale

La fonte (organizzazione):

UNESCO Institute for Statistics

Categorie:

Education

sono stati aggiornati

23 apr 2017 anni

Indicatori delle variazioni dei valori per anni

In media:
24.914
Minima:
15.928
1 gen 2011 anni
Massimo:
44.888
1 gen 1999 anni
Alla data di osservazione
Valore
Variazione assoluta
La variazione rispetto al valore precedente
1 gen 1999 anni
44.888
+44.888
0.0%
1 gen 2001 anni
35.19
-9.697
-21.6%
1 gen 2002 anni
31.618
-3.572
-10.15%
1 gen 2005 anni
24.137
-7.481
-23.66%
1 gen 2006 anni
23.845
-0.292
-1.21%
1 gen 2007 anni
27.21
+3.364
14.11%
1 gen 2009 anni
20.317
-6.893
-25.33%
1 gen 2010 anni
20.549
+0.232
1.14%
1 gen 2011 anni
15.928
-4.621
-22.49%
1 gen 2012 anni
19.215
+3.287
20.63%
1 gen 2013 anni
18.076
-1.139
-5.93%
1 gen 2014 anni
17.996
-0.08
-0.44%

Classificazione dei paesi secondo i statistiche attuali per anni