29
/it/
it
AIzaSyAYiBZKx7MnpbEhh9jyipgxe19OcubqV5w
April 1, 2024
194265
Mauritius
MUS
true
2
1
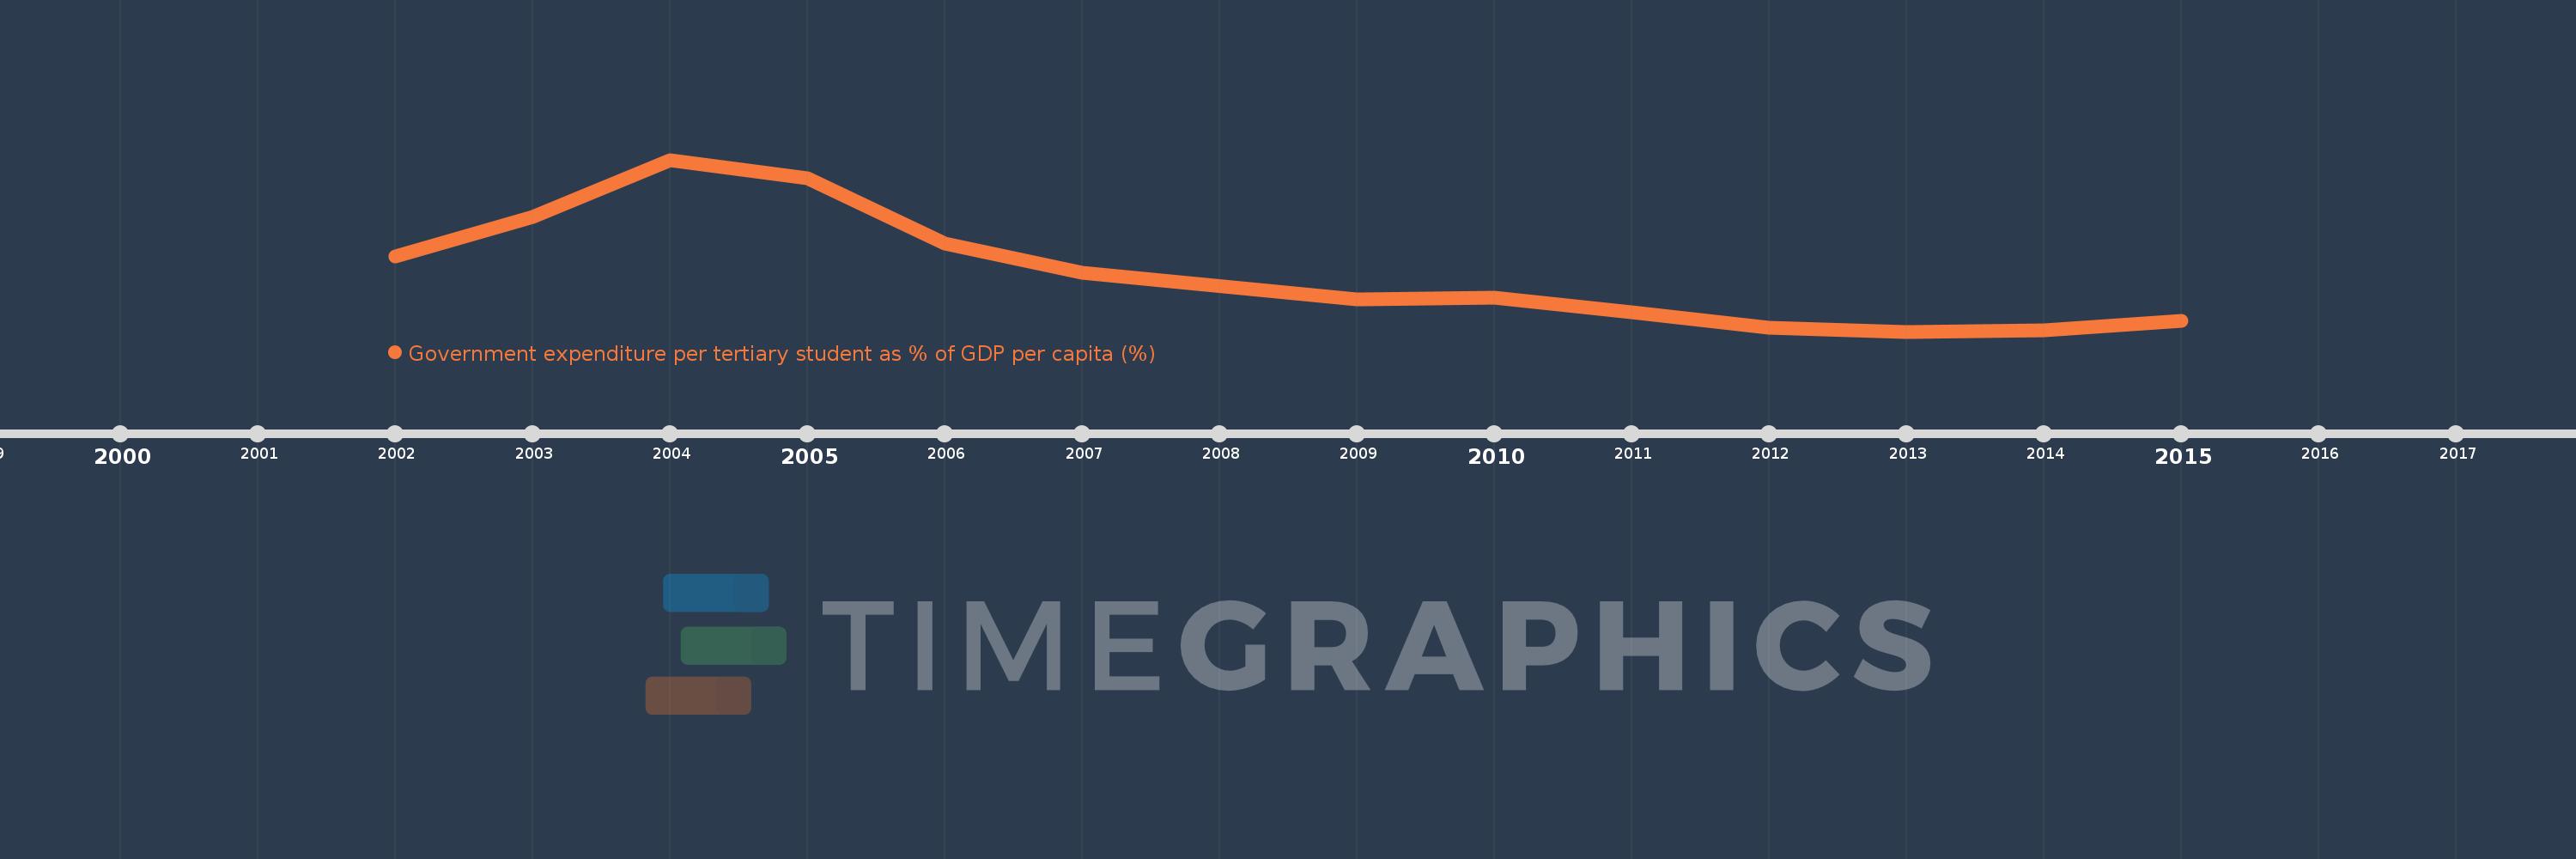
Government expenditure per tertiary student as % of GDP per capita (%)
2015,2014,2013,2012,2011,2010,2009,2007,2006,2005,2004,2003,2002
Queste statistiche in altri paesi:
Linea del tempo:
Questa scala temporale mostra un grafico dal 2002 anno al 2015 anno. Mauritius. I dati fino ad 2001 anno non disponibili. Il numero di osservazioni attuali secondo i date: 13.
La fonte (nome):
Indicatori dello sviluppo mondiale
La fonte (organizzazione):
UNESCO Institute for Statistics
Categorie:
Education
sono stati aggiornati
23 apr 2017 anni
Indicatori delle variazioni dei valori per anni
Minima:
8.554
1 gen 2013 anni
Massimo:
47.109
1 gen 2004 anni
Alla data di osservazione
Valore
Variazione assoluta
La variazione rispetto al valore precedente
1 gen 2002 anni
25.425
+25.425
0.0%
1 gen 2003 anni
34.35
+8.925
35.1%
1 gen 2004 anni
47.109
+12.759
37.14%
1 gen 2005 anni
43.046
-4.063
-8.63%
1 gen 2006 anni
28.378
-14.668
-34.08%
1 gen 2007 anni
21.8
-6.578
-23.18%
1 gen 2009 anni
15.85
-5.949
-27.29%
1 gen 2010 anni
16.118
+0.267
1.69%
1 gen 2011 anni
12.806
-3.311
-20.55%
1 gen 2012 anni
9.473
-3.333
-26.02%
1 gen 2013 anni
8.554
-0.92
-9.71%
1 gen 2014 anni
8.917
+0.363
4.25%
1 gen 2015 anni
10.967
+2.05
22.98%
Classificazione dei paesi secondo i statistiche attuali per anni


Commenti: