29
/it/
it
AIzaSyAYiBZKx7MnpbEhh9jyipgxe19OcubqV5w
April 1, 2024
73900
Austria
AUT
true
2
1
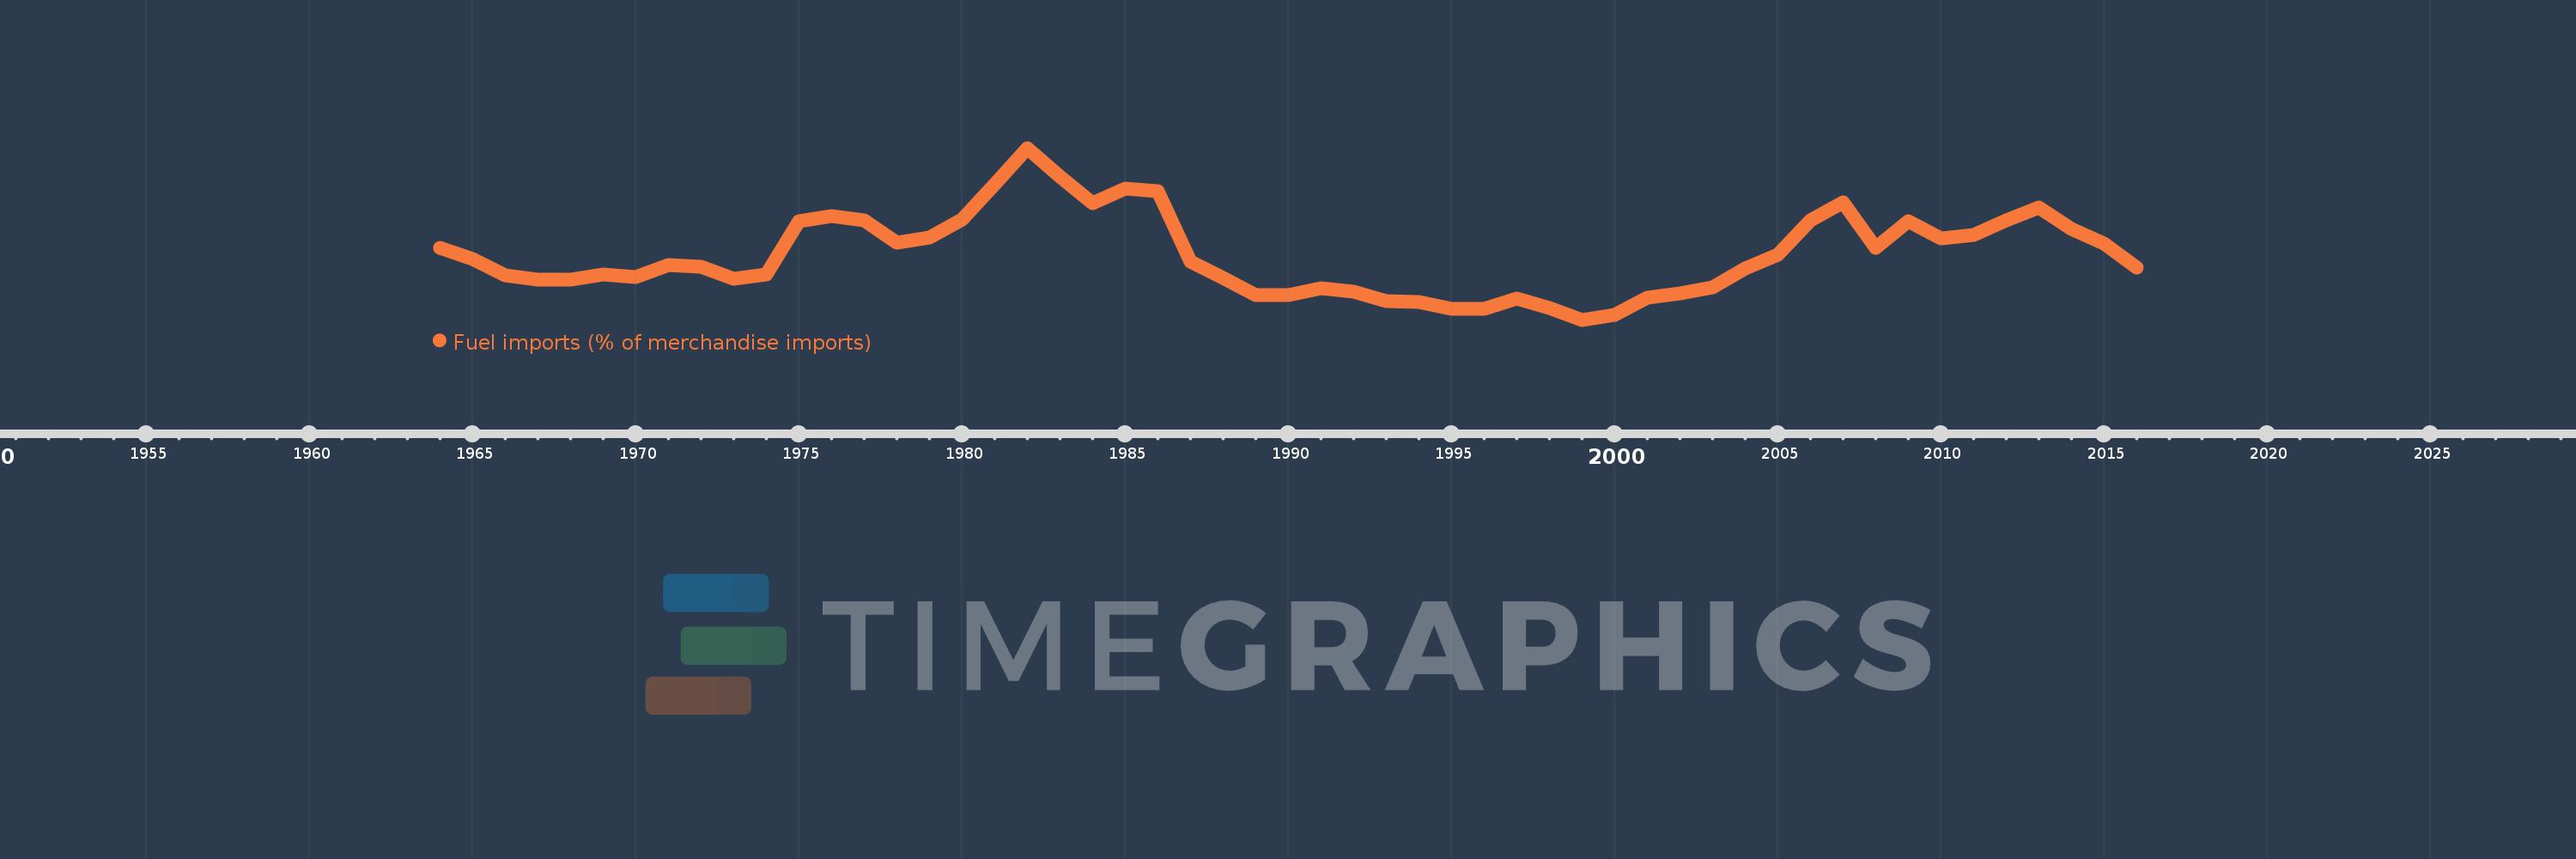
Fuel imports (% of merchandise imports)
2016,2015,2014,2013,2012,2011,2010,2009,2008,2007,2006,2005,2004,2003,2002,2001,2000,1999,1998,1997,1996,1995,1994,1993,1992,1991,1990,1989,1988,1987,1986,1985,1984,1983,1982,1981,1980,1979,1978,1977,1976,1975,1974,1973,1972,1971,1970,1969,1968,1967,1966,1965,1964
Queste statistiche in altri paesi:
AfghanistanAlbaniaAlgeriaAndorraAngolaAntigua and BarbudaArab WorldArgentinaArmeniaArubaAustraliaAustriaAzerbaijanBahamas, TheBahrainBangladeshBarbadosBelarusBelgiumBelizeBeninBermudaBhutanBoliviaBosnia and HerzegovinaBotswanaBrazilBrunei DarussalamBulgariaBurkina FasoBurundiCabo VerdeCambodiaCameroonCanadaCaribbean small statesCayman IslandsCentral African RepublicCentral Europe and the BalticsChadChileChinaColombiaComorosCongo, Dem. Rep.Congo, Rep.Costa RicaCote d'IvoireCroatiaCubaCyprusCzech RepublicDenmarkDjiboutiDominicaDominican RepublicEarly-demographic dividendEast Asia & PacificEast Asia & Pacific (excluding high income)East Asia & Pacific (IDA & IBRD countries)EcuadorEgypt, Arab Rep.El SalvadorEquatorial GuineaEritreaEstoniaEthiopiaEuro areaEurope & Central AsiaEurope & Central Asia (excluding high income)Europe & Central Asia (IDA & IBRD countries)European UnionFaroe IslandsFijiFinlandFragile and conflict affected situationsFranceFrench PolynesiaGabonGambia, TheGeorgiaGermanyGhanaGreeceGreenlandGrenadaGuatemalaGuineaGuinea-BissauGuyanaHaitiHeavily indebted poor countries (HIPC)High incomeHondurasHong Kong SAR, ChinaHungaryIBRD onlyIcelandIDA & IBRD totalIDA blendIDA onlyIDA totalIndiaIndonesiaIran, Islamic Rep.IraqIrelandIsraelItalyJamaicaJapanJordanKazakhstanKenyaKiribatiKorea, Rep.KuwaitKyrgyz RepublicLao PDRLate-demographic dividendLatin America & Caribbean Latin America & Caribbean (excluding high income)Latin America & the Caribbean (IDA & IBRD countries)LatviaLeast developed countries: UN classificationLebanonLesothoLiberiaLibyaLithuaniaLow & middle incomeLow incomeLower middle incomeLuxembourgMacao SAR, ChinaMacedonia, FYRMadagascarMalawiMalaysiaMaldivesMaliMaltaMauritaniaMauritiusMexicoMiddle East & North AfricaMiddle East & North Africa (excluding high income)Middle East & North Africa (IDA & IBRD countries)Middle incomeMoldovaMongoliaMoroccoMozambiqueMyanmarNamibiaNepalNetherlandsNew CaledoniaNew ZealandNicaraguaNigerNigeriaNorth AmericaNorwayOECD membersOmanOther small statesPacific island small statesPakistanPalauPanamaPapua New GuineaParaguayPeruPhilippinesPolandPortugalPost-demographic dividendPre-demographic dividendQatarRomaniaRussian FederationRwandaSamoaSao Tome and PrincipeSaudi ArabiaSenegalSerbiaSeychellesSierra LeoneSingaporeSlovak RepublicSloveniaSmall statesSolomon IslandsSomaliaSouth AfricaSouth AsiaSouth Asia (IDA & IBRD)SpainSri LankaSt. Kitts and NevisSt. LuciaSt. Vincent and the GrenadinesSub-Saharan Africa Sub-Saharan Africa (excluding high income)Sub-Saharan Africa (IDA & IBRD countries)SudanSurinameSwazilandSwedenSwitzerlandSyrian Arab RepublicTajikistanTanzaniaThailandTimor-LesteTogoTongaTrinidad and TobagoTunisiaTurkeyTurkmenistanTurks and Caicos IslandsTuvaluUgandaUkraineUnited Arab EmiratesUnited KingdomUnited StatesUpper middle incomeUruguayVanuatuVenezuela, RBVietnamVirgin Islands (U.S.)WorldYemen, Rep.ZambiaZimbabwe Linea del tempo:
Questa scala temporale mostra un grafico dal 1964 anno al 2016 anno. Austria. I dati fino ad 1963 anno non disponibili. Il numero di osservazioni attuali secondo i date: 53.
La fonte (nome):
Indicatori dello sviluppo mondiale
La fonte (organizzazione):
World Bank staff estimates from the Comtrade database maintained by the United Nations Statistics Division.
Categorie:
Energy & Mining, Private Sector, Trade
sono stati aggiornati
23 apr 2017 anni
Indicatori delle variazioni dei valori per anni
Minima:
3.516
1 gen 1999 anni
Massimo:
18.657
1 gen 1982 anni
Alla data di osservazione
Valore
Variazione assoluta
La variazione rispetto al valore precedente
1 gen 1964 anni
9.831
+9.831
0.0%
1 gen 1965 anni
8.858
-0.973
-9.9%
1 gen 1966 anni
7.406
-1.451
-16.39%
1 gen 1967 anni
7.081
-0.326
-4.39%
1 gen 1968 anni
7.016
-0.065
-0.92%
1 gen 1969 anni
7.536
+0.52
7.41%
1 gen 1970 anni
7.257
-0.279
-3.71%
1 gen 1971 anni
8.314
+1.057
14.57%
1 gen 1972 anni
8.162
-0.152
-1.82%
1 gen 1973 anni
7.132
-1.03
-12.62%
1 gen 1974 anni
7.505
+0.373
5.23%
1 gen 1975 anni
12.194
+4.689
62.48%
1 gen 1976 anni
12.675
+0.481
3.94%
1 gen 1977 anni
12.257
-0.418
-3.3%
1 gen 1978 anni
10.319
-1.938
-15.81%
1 gen 1979 anni
10.733
+0.415
4.02%
1 gen 1980 anni
12.355
+1.622
15.11%
1 gen 1981 anni
15.488
+3.133
25.36%
1 gen 1982 anni
18.657
+3.169
20.46%
1 gen 1983 anni
16.141
-2.516
-13.48%
1 gen 1984 anni
13.805
-2.336
-14.47%
1 gen 1985 anni
15.097
+1.291
9.35%
1 gen 1986 anni
14.855
-0.241
-1.6%
1 gen 1987 anni
8.659
-6.197
-41.71%
1 gen 1988 anni
7.225
-1.433
-16.55%
1 gen 1989 anni
5.68
-1.545
-21.39%
1 gen 1990 anni
5.715
+0.035
0.62%
1 gen 1991 anni
6.33
+0.615
10.76%
1 gen 1992 anni
6.004
-0.326
-5.15%
1 gen 1993 anni
5.156
-0.849
-14.14%
1 gen 1994 anni
5.073
-0.082
-1.59%
1 gen 1995 anni
4.449
-0.624
-12.3%
1 gen 1996 anni
4.494
+0.045
1.01%
1 gen 1997 anni
5.407
+0.913
20.31%
1 gen 1998 anni
4.518
-0.89
-16.45%
1 gen 1999 anni
3.516
-1.001
-22.17%
1 gen 2000 anni
3.983
+0.467
13.27%
1 gen 2001 anni
5.451
+1.468
36.86%
1 gen 2002 anni
5.863
+0.412
7.56%
1 gen 2003 anni
6.365
+0.502
8.57%
1 gen 2004 anni
8.054
+1.689
26.54%
1 gen 2005 anni
9.235
+1.181
14.66%
1 gen 2006 anni
12.303
+3.068
33.22%
1 gen 2007 anni
13.848
+1.545
12.56%
1 gen 2008 anni
9.861
-3.987
-28.79%
1 gen 2009 anni
12.175
+2.314
23.46%
1 gen 2010 anni
10.721
-1.454
-11.94%
1 gen 2011 anni
10.972
+0.251
2.34%
1 gen 2012 anni
12.258
+1.286
11.72%
1 gen 2013 anni
13.399
+1.142
9.31%
1 gen 2014 anni
11.547
-1.852
-13.82%
1 gen 2015 anni
10.223
-1.325
-11.47%
1 gen 2016 anni
8.104
-2.118
-20.72%
Classificazione dei paesi secondo i statistiche attuali per anni


Commenti: