29
/it/
it
AIzaSyAYiBZKx7MnpbEhh9jyipgxe19OcubqV5w
April 1, 2024
134098
France
FRA
true
2
1
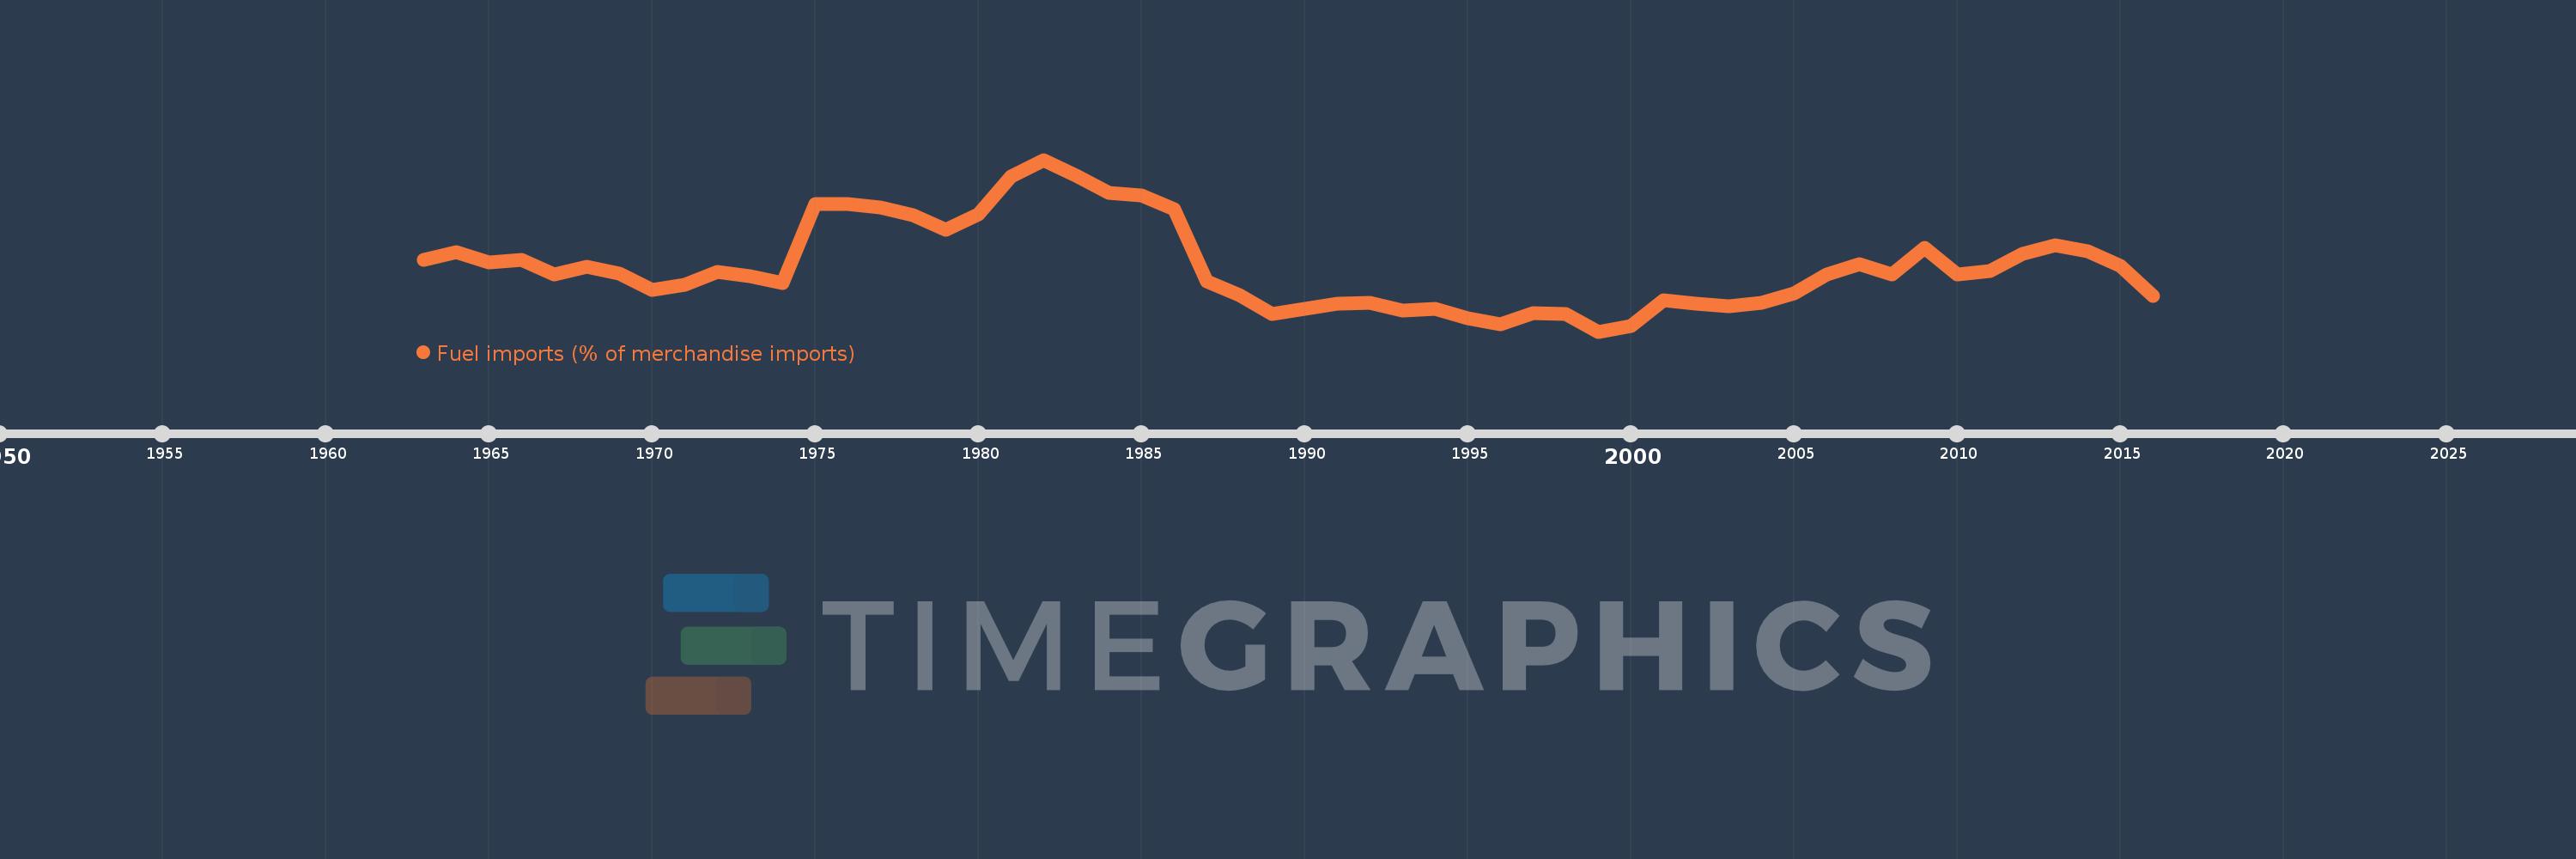
Fuel imports (% of merchandise imports)
2016,2015,2014,2013,2012,2011,2010,2009,2008,2007,2006,2005,2004,2003,2002,2001,2000,1999,1998,1997,1996,1995,1994,1993,1992,1991,1990,1989,1988,1987,1986,1985,1984,1983,1982,1981,1980,1979,1978,1977,1976,1975,1974,1973,1972,1971,1970,1969,1968,1967,1966,1965,1964,1963
Queste statistiche in altri paesi:
AfghanistanAlbaniaAlgeriaAndorraAngolaAntigua and BarbudaArab WorldArgentinaArmeniaArubaAustraliaAustriaAzerbaijanBahamas, TheBahrainBangladeshBarbadosBelarusBelgiumBelizeBeninBermudaBhutanBoliviaBosnia and HerzegovinaBotswanaBrazilBrunei DarussalamBulgariaBurkina FasoBurundiCabo VerdeCambodiaCameroonCanadaCaribbean small statesCayman IslandsCentral African RepublicCentral Europe and the BalticsChadChileChinaColombiaComorosCongo, Dem. Rep.Congo, Rep.Costa RicaCote d'IvoireCroatiaCubaCyprusCzech RepublicDenmarkDjiboutiDominicaDominican RepublicEarly-demographic dividendEast Asia & PacificEast Asia & Pacific (excluding high income)East Asia & Pacific (IDA & IBRD countries)EcuadorEgypt, Arab Rep.El SalvadorEquatorial GuineaEritreaEstoniaEthiopiaEuro areaEurope & Central AsiaEurope & Central Asia (excluding high income)Europe & Central Asia (IDA & IBRD countries)European UnionFaroe IslandsFijiFinlandFragile and conflict affected situationsFranceFrench PolynesiaGabonGambia, TheGeorgiaGermanyGhanaGreeceGreenlandGrenadaGuatemalaGuineaGuinea-BissauGuyanaHaitiHeavily indebted poor countries (HIPC)High incomeHondurasHong Kong SAR, ChinaHungaryIBRD onlyIcelandIDA & IBRD totalIDA blendIDA onlyIDA totalIndiaIndonesiaIran, Islamic Rep.IraqIrelandIsraelItalyJamaicaJapanJordanKazakhstanKenyaKiribatiKorea, Rep.KuwaitKyrgyz RepublicLao PDRLate-demographic dividendLatin America & Caribbean Latin America & Caribbean (excluding high income)Latin America & the Caribbean (IDA & IBRD countries)LatviaLeast developed countries: UN classificationLebanonLesothoLiberiaLibyaLithuaniaLow & middle incomeLow incomeLower middle incomeLuxembourgMacao SAR, ChinaMacedonia, FYRMadagascarMalawiMalaysiaMaldivesMaliMaltaMauritaniaMauritiusMexicoMiddle East & North AfricaMiddle East & North Africa (excluding high income)Middle East & North Africa (IDA & IBRD countries)Middle incomeMoldovaMongoliaMoroccoMozambiqueMyanmarNamibiaNepalNetherlandsNew CaledoniaNew ZealandNicaraguaNigerNigeriaNorth AmericaNorwayOECD membersOmanOther small statesPacific island small statesPakistanPalauPanamaPapua New GuineaParaguayPeruPhilippinesPolandPortugalPost-demographic dividendPre-demographic dividendQatarRomaniaRussian FederationRwandaSamoaSao Tome and PrincipeSaudi ArabiaSenegalSerbiaSeychellesSierra LeoneSingaporeSlovak RepublicSloveniaSmall statesSolomon IslandsSomaliaSouth AfricaSouth AsiaSouth Asia (IDA & IBRD)SpainSri LankaSt. Kitts and NevisSt. LuciaSt. Vincent and the GrenadinesSub-Saharan Africa Sub-Saharan Africa (excluding high income)Sub-Saharan Africa (IDA & IBRD countries)SudanSurinameSwazilandSwedenSwitzerlandSyrian Arab RepublicTajikistanTanzaniaThailandTimor-LesteTogoTongaTrinidad and TobagoTunisiaTurkeyTurkmenistanTurks and Caicos IslandsTuvaluUgandaUkraineUnited Arab EmiratesUnited KingdomUnited StatesUpper middle incomeUruguayVanuatuVenezuela, RBVietnamVirgin Islands (U.S.)WorldYemen, Rep.ZambiaZimbabwe Linea del tempo:
Questa scala temporale mostra un grafico dal 1963 anno al 2016 anno. France. I dati fino ad 1962 anno non disponibili. Il numero di osservazioni attuali secondo i date: 54.
La fonte (nome):
Indicatori dello sviluppo mondiale
La fonte (organizzazione):
World Bank staff estimates from the Comtrade database maintained by the United Nations Statistics Division.
Categorie:
Energy & Mining, Private Sector, Trade
sono stati aggiornati
23 apr 2017 anni
Indicatori delle variazioni dei valori per anni
Minima:
5.858
1 gen 1999 anni
Massimo:
28.826
1 gen 1982 anni
Alla data di osservazione
Valore
Variazione assoluta
La variazione rispetto al valore precedente
1 gen 1963 anni
15.422
+15.422
0.0%
1 gen 1964 anni
16.538
+1.116
7.23%
1 gen 1965 anni
15.143
-1.395
-8.43%
1 gen 1966 anni
15.477
+0.334
2.2%
1 gen 1967 anni
13.548
-1.929
-12.46%
1 gen 1968 anni
14.508
+0.959
7.08%
1 gen 1969 anni
13.658
-0.85
-5.86%
1 gen 1970 anni
11.404
-2.254
-16.5%
1 gen 1971 anni
12.109
+0.705
6.18%
1 gen 1972 anni
13.877
+1.768
14.6%
1 gen 1973 anni
13.226
-0.65
-4.69%
1 gen 1974 anni
12.362
-0.865
-6.54%
1 gen 1975 anni
22.894
+10.532
85.2%
1 gen 1976 anni
22.87
-0.024
-0.1%
1 gen 1977 anni
22.447
-0.424
-1.85%
1 gen 1978 anni
21.471
-0.975
-4.34%
1 gen 1979 anni
19.467
-2.004
-9.33%
1 gen 1980 anni
21.505
+2.038
10.47%
1 gen 1981 anni
26.596
+5.091
23.67%
1 gen 1982 anni
28.826
+2.23
8.38%
1 gen 1983 anni
26.701
-2.125
-7.37%
1 gen 1984 anni
24.461
-2.24
-8.39%
1 gen 1985 anni
24.037
-0.425
-1.74%
1 gen 1986 anni
22.257
-1.78
-7.4%
1 gen 1987 anni
12.627
-9.63
-43.27%
1 gen 1988 anni
10.75
-1.877
-14.87%
1 gen 1989 anni
8.241
-2.509
-23.34%
1 gen 1990 anni
8.851
+0.61
7.41%
1 gen 1991 anni
9.581
+0.73
8.24%
1 gen 1992 anni
9.686
+0.105
1.09%
1 gen 1993 anni
8.623
-1.062
-10.97%
1 gen 1994 anni
8.9
+0.277
3.21%
1 gen 1995 anni
7.693
-1.207
-13.56%
1 gen 1996 anni
6.798
-0.895
-11.64%
1 gen 1997 anni
8.302
+1.504
22.12%
1 gen 1998 anni
8.184
-0.118
-1.42%
1 gen 1999 anni
5.858
-2.326
-28.43%
1 gen 2000 anni
6.604
+0.747
12.75%
1 gen 2001 anni
10.008
+3.404
51.54%
1 gen 2002 anni
9.621
-0.387
-3.86%
1 gen 2003 anni
9.289
-0.332
-3.45%
1 gen 2004 anni
9.746
+0.456
4.91%
1 gen 2005 anni
10.927
+1.182
12.13%
1 gen 2006 anni
13.552
+2.625
24.02%
1 gen 2007 anni
14.857
+1.304
9.62%
1 gen 2008 anni
13.55
-1.307
-8.8%
1 gen 2009 anni
17.083
+3.533
26.07%
1 gen 2010 anni
13.495
-3.588
-21.0%
1 gen 2011 anni
13.984
+0.489
3.62%
1 gen 2012 anni
16.232
+2.248
16.08%
1 gen 2013 anni
17.427
+1.195
7.36%
1 gen 2014 anni
16.623
-0.804
-4.61%
1 gen 2015 anni
14.687
-1.936
-11.65%
1 gen 2016 anni
10.661
-4.026
-27.41%
Classificazione dei paesi secondo i statistiche attuali per anni


Commenti: