29
/it/
it
AIzaSyAYiBZKx7MnpbEhh9jyipgxe19OcubqV5w
April 1, 2024
35732
High income
HIC
false
2
1
Fuel imports (% of merchandise imports)
2016,2015,2014,2013,2012,2011,2010,2009,2008,2007,2006,2005,2004,2003,2002,2001,2000,1999,1998,1997,1996,1995,1994,1993,1992,1991,1990,1989,1988,1987,1986,1985,1984,1983,1982,1981,1980,1979,1978,1977,1976,1975,1974,1973,1972,1971,1970,1969,1968,1967,1966,1965,1964,1963
Queste statistiche in altri paesi:
AfghanistanAlbaniaAlgeriaAndorraAngolaAntigua and BarbudaArab WorldArgentinaArmeniaArubaAustraliaAustriaAzerbaijanBahamas, TheBahrainBangladeshBarbadosBelarusBelgiumBelizeBeninBermudaBhutanBoliviaBosnia and HerzegovinaBotswanaBrazilBrunei DarussalamBulgariaBurkina FasoBurundiCabo VerdeCambodiaCameroonCanadaCaribbean small statesCayman IslandsCentral African RepublicCentral Europe and the BalticsChadChileChinaColombiaComorosCongo, Dem. Rep.Congo, Rep.Costa RicaCote d'IvoireCroatiaCubaCyprusCzech RepublicDenmarkDjiboutiDominicaDominican RepublicEarly-demographic dividendEast Asia & PacificEast Asia & Pacific (excluding high income)East Asia & Pacific (IDA & IBRD countries)EcuadorEgypt, Arab Rep.El SalvadorEquatorial GuineaEritreaEstoniaEthiopiaEuro areaEurope & Central AsiaEurope & Central Asia (excluding high income)Europe & Central Asia (IDA & IBRD countries)European UnionFaroe IslandsFijiFinlandFragile and conflict affected situationsFranceFrench PolynesiaGabonGambia, TheGeorgiaGermanyGhanaGreeceGreenlandGrenadaGuatemalaGuineaGuinea-BissauGuyanaHaitiHeavily indebted poor countries (HIPC)High incomeHondurasHong Kong SAR, ChinaHungaryIBRD onlyIcelandIDA & IBRD totalIDA blendIDA onlyIDA totalIndiaIndonesiaIran, Islamic Rep.IraqIrelandIsraelItalyJamaicaJapanJordanKazakhstanKenyaKiribatiKorea, Rep.KuwaitKyrgyz RepublicLao PDRLate-demographic dividendLatin America & Caribbean Latin America & Caribbean (excluding high income)Latin America & the Caribbean (IDA & IBRD countries)LatviaLeast developed countries: UN classificationLebanonLesothoLiberiaLibyaLithuaniaLow & middle incomeLow incomeLower middle incomeLuxembourgMacao SAR, ChinaMacedonia, FYRMadagascarMalawiMalaysiaMaldivesMaliMaltaMauritaniaMauritiusMexicoMiddle East & North AfricaMiddle East & North Africa (excluding high income)Middle East & North Africa (IDA & IBRD countries)Middle incomeMoldovaMongoliaMoroccoMozambiqueMyanmarNamibiaNepalNetherlandsNew CaledoniaNew ZealandNicaraguaNigerNigeriaNorth AmericaNorwayOECD membersOmanOther small statesPacific island small statesPakistanPalauPanamaPapua New GuineaParaguayPeruPhilippinesPolandPortugalPost-demographic dividendPre-demographic dividendQatarRomaniaRussian FederationRwandaSamoaSao Tome and PrincipeSaudi ArabiaSenegalSerbiaSeychellesSierra LeoneSingaporeSlovak RepublicSloveniaSmall statesSolomon IslandsSomaliaSouth AfricaSouth AsiaSouth Asia (IDA & IBRD)SpainSri LankaSt. Kitts and NevisSt. LuciaSt. Vincent and the GrenadinesSub-Saharan Africa Sub-Saharan Africa (excluding high income)Sub-Saharan Africa (IDA & IBRD countries)SudanSurinameSwazilandSwedenSwitzerlandSyrian Arab RepublicTajikistanTanzaniaThailandTimor-LesteTogoTongaTrinidad and TobagoTunisiaTurkeyTurkmenistanTurks and Caicos IslandsTuvaluUgandaUkraineUnited Arab EmiratesUnited KingdomUnited StatesUpper middle incomeUruguayVanuatuVenezuela, RBVietnamVirgin Islands (U.S.)WorldYemen, Rep.ZambiaZimbabwe Linea del tempo:
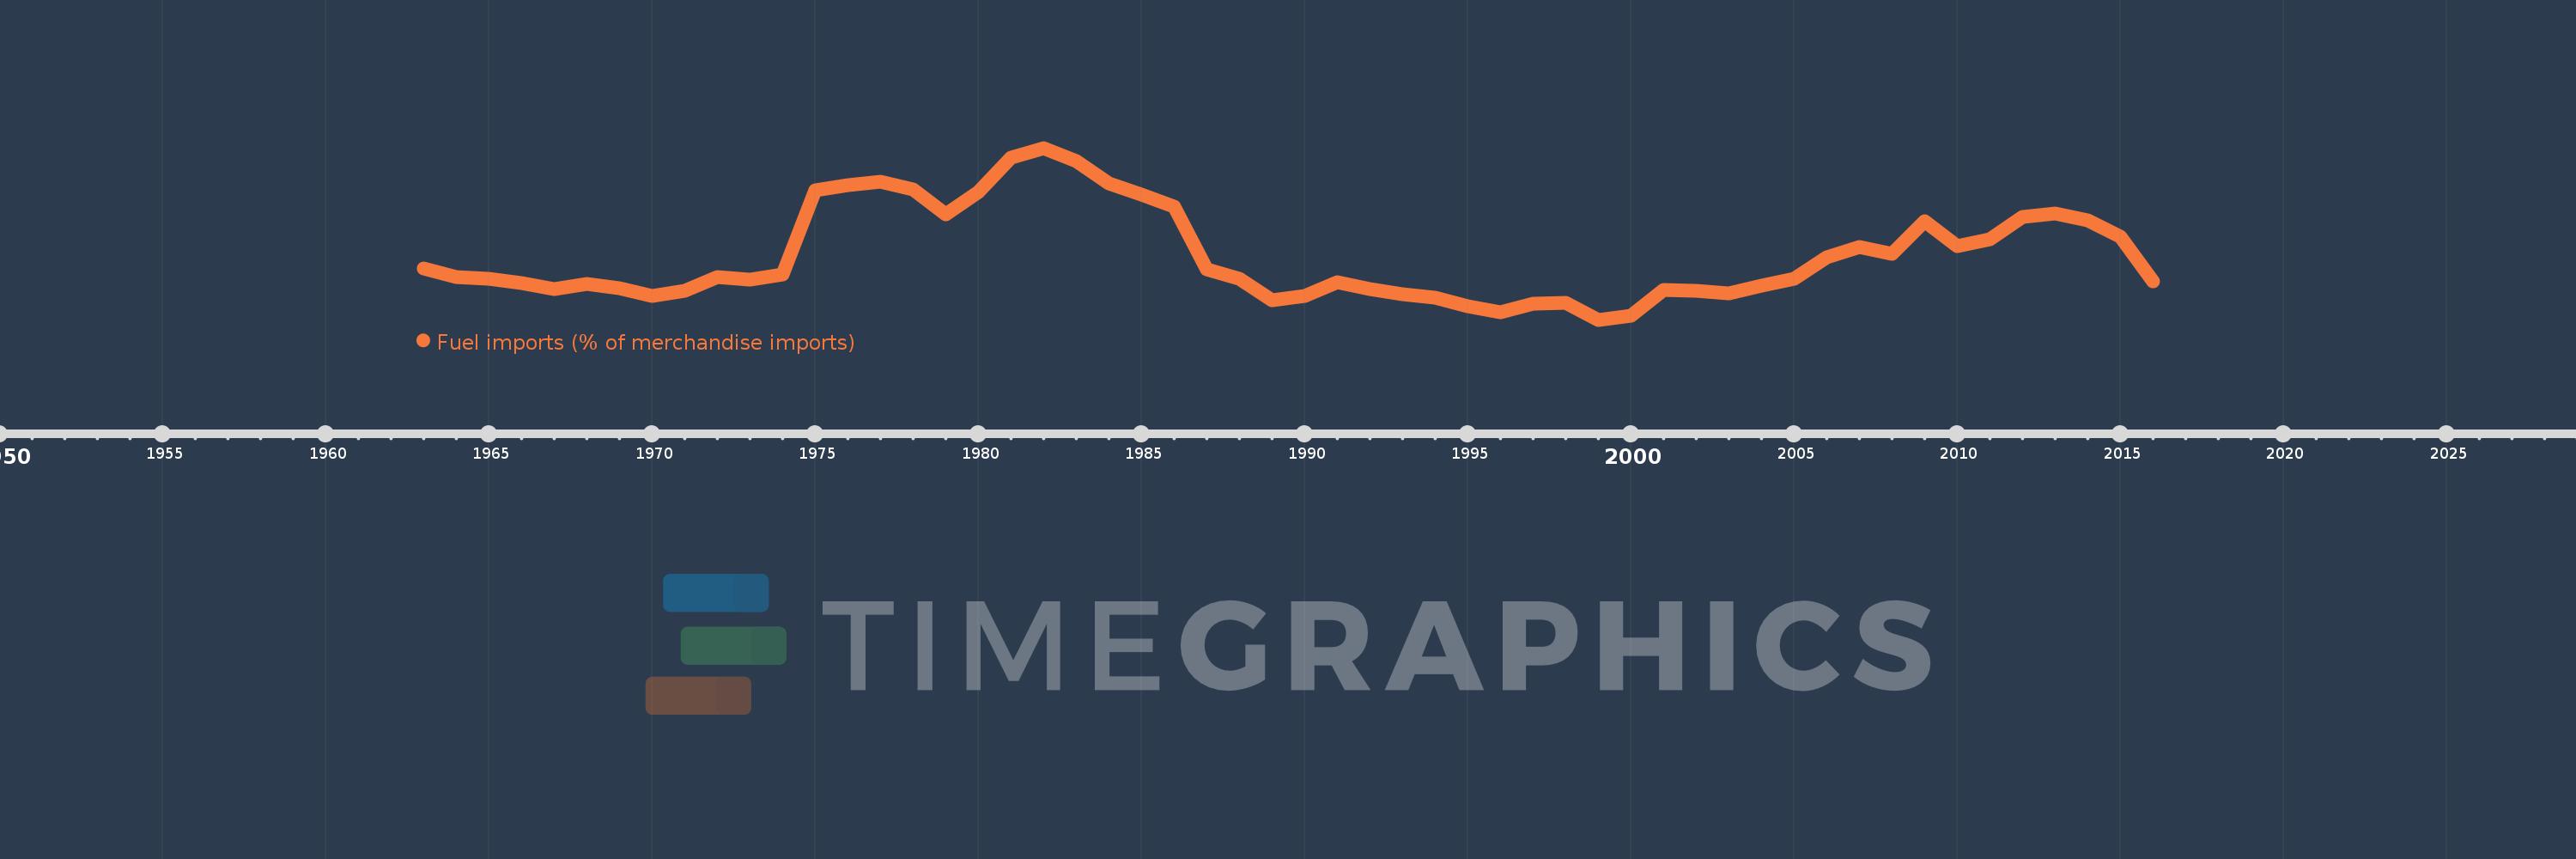
Questa scala temporale mostra un grafico dal 1963 anno al 2016 anno. High income. I dati fino ad 1962 anno non disponibili. Il numero di osservazioni attuali secondo i date: 54.
La fonte (nome):
Indicatori dello sviluppo mondiale
La fonte (organizzazione):
World Bank staff estimates from the Comtrade database maintained by the United Nations Statistics Division.
Categorie:
Energy & Mining, Private Sector, Trade
sono stati aggiornati
23 apr 2017 anni
Indicatori delle variazioni dei valori per anni
Minima:
6.678
1 gen 1999 anni
Massimo:
26.162
1 gen 1982 anni
Alla data di osservazione
Valore
Variazione assoluta
La variazione rispetto al valore precedente
1 gen 1963 anni
12.497
+12.497
0.0%
1 gen 1964 anni
11.541
-0.956
-7.65%
1 gen 1965 anni
11.294
-0.247
-2.14%
1 gen 1966 anni
10.865
-0.429
-3.8%
1 gen 1967 anni
10.141
-0.724
-6.66%
1 gen 1968 anni
10.756
+0.614
6.06%
1 gen 1969 anni
10.228
-0.528
-4.91%
1 gen 1970 anni
9.414
-0.813
-7.95%
1 gen 1971 anni
9.944
+0.53
5.63%
1 gen 1972 anni
11.546
+1.602
16.11%
1 gen 1973 anni
11.276
-0.27
-2.34%
1 gen 1974 anni
11.777
+0.501
4.44%
1 gen 1975 anni
21.363
+9.587
81.4%
1 gen 1976 anni
21.969
+0.606
2.84%
1 gen 1977 anni
22.381
+0.412
1.87%
1 gen 1978 anni
21.416
-0.965
-4.31%
1 gen 1979 anni
18.621
-2.795
-13.05%
1 gen 1980 anni
21.147
+2.526
13.57%
1 gen 1981 anni
25.022
+3.876
18.33%
1 gen 1982 anni
26.162
+1.14
4.56%
1 gen 1983 anni
24.623
-1.54
-5.89%
1 gen 1984 anni
22.137
-2.486
-10.1%
1 gen 1985 anni
20.88
-1.256
-5.68%
1 gen 1986 anni
19.523
-1.358
-6.5%
1 gen 1987 anni
12.432
-7.091
-36.32%
1 gen 1988 anni
11.337
-1.095
-8.81%
1 gen 1989 anni
8.88
-2.457
-21.67%
1 gen 1990 anni
9.367
+0.487
5.48%
1 gen 1991 anni
10.961
+1.594
17.02%
1 gen 1992 anni
10.171
-0.79
-7.21%
1 gen 1993 anni
9.53
-0.64
-6.3%
1 gen 1994 anni
9.164
-0.366
-3.84%
1 gen 1995 anni
8.212
-0.952
-10.39%
1 gen 1996 anni
7.497
-0.715
-8.7%
1 gen 1997 anni
8.547
+1.049
13.99%
1 gen 1998 anni
8.633
+0.086
1.0%
1 gen 1999 anni
6.678
-1.954
-22.64%
1 gen 2000 anni
7.151
+0.473
7.08%
1 gen 2001 anni
10.038
+2.886
40.36%
1 gen 2002 anni
9.979
-0.059
-0.58%
1 gen 2003 anni
9.687
-0.292
-2.92%
1 gen 2004 anni
10.534
+0.847
8.74%
1 gen 2005 anni
11.342
+0.808
7.67%
1 gen 2006 anni
13.739
+2.397
21.13%
1 gen 2007 anni
14.925
+1.186
8.63%
1 gen 2008 anni
14.126
-0.799
-5.36%
1 gen 2009 anni
17.831
+3.705
26.23%
1 gen 2010 anni
14.986
-2.845
-15.96%
1 gen 2011 anni
15.838
+0.852
5.69%
1 gen 2012 anni
18.291
+2.452
15.48%
1 gen 2013 anni
18.704
+0.413
2.26%
1 gen 2014 anni
17.918
-0.785
-4.2%
1 gen 2015 anni
16.103
-1.815
-10.13%
1 gen 2016 anni
11.056
-5.047
-31.34%
Classificazione dei paesi secondo i statistiche attuali per anni


Commenti: