30
/it/
AIzaSyAYiBZKx7MnpbEhh9jyipgxe19OcubqV5w
April 1, 2024
71961
Armenia
ARM
true
2
1
Total reserves (% of total external debt)
2016,2015,2014,2013,2012,2011,2010,2009,2008,2007,2006,2005,2004,2003,2002,2001,2000,1999,1998,1997,1996,1995,1994
Download
Biblioteca di statistiche globali →Armenia →

Total reserves (% of total external debt)

Queste statistiche in altri paesi:

AfghanistanAlbaniaAlgeriaAngolaArab WorldArgentinaArmeniaAzerbaijanBangladeshBelarusBelizeBeninBhutanBoliviaBosnia and HerzegovinaBotswanaBrazilBulgariaBurkina FasoBurundiCabo VerdeCambodiaCameroonCaribbean small statesCentral African RepublicCentral Europe and the BalticsChadChinaColombiaComorosCongo, Dem. Rep.Congo, Rep.Costa RicaCote d'IvoireDjiboutiDominicaDominican RepublicEarly-demographic dividendEast Asia & PacificEast Asia & Pacific (excluding high income)East Asia & Pacific (IDA & IBRD countries)EcuadorEgypt, Arab Rep.El SalvadorEritreaEthiopiaEurope & Central AsiaEurope & Central Asia (excluding high income)Europe & Central Asia (IDA & IBRD countries)FijiFragile and conflict affected situationsGabonGambia, TheGeorgiaGhanaGrenadaGuatemalaGuineaGuinea-BissauGuyanaHaitiHeavily indebted poor countries (HIPC)HondurasIBRD onlyIDA & IBRD totalIDA blendIDA onlyIDA totalIndiaIndonesiaIran, Islamic Rep.JamaicaJordanKazakhstanKenyaKosovoKyrgyz RepublicLao PDRLate-demographic dividendLatin America & Caribbean Latin America & Caribbean (excluding high income)Latin America & the Caribbean (IDA & IBRD countries)Least developed countries: UN classificationLebanonLesothoLiberiaLow & middle incomeLow incomeLower middle incomeMacedonia, FYRMadagascarMalawiMalaysiaMaldivesMaliMauritaniaMauritiusMexicoMiddle East & North AfricaMiddle East & North Africa (excluding high income)Middle East & North Africa (IDA & IBRD countries)Middle incomeMoldovaMongoliaMontenegroMoroccoMozambiqueMyanmarNepalNicaraguaNigerNigeriaOther small statesPacific island small statesPakistanPanamaPapua New GuineaParaguayPeruPhilippinesPre-demographic dividendRomaniaRussian FederationRwandaSamoaSao Tome and PrincipeSenegalSerbiaSierra LeoneSmall statesSolomon IslandsSouth AfricaSouth AsiaSouth Asia (IDA & IBRD)Sri LankaSt. LuciaSt. Vincent and the GrenadinesSub-Saharan Africa Sub-Saharan Africa (excluding high income)Sub-Saharan Africa (IDA & IBRD countries)SudanSwazilandSyrian Arab RepublicTajikistanTanzaniaThailandTogoTongaTunisiaTurkeyUgandaUkraineUpper middle incomeVanuatuVenezuela, RBVietnamYemen, Rep.ZambiaZimbabwe

Linea del tempo:

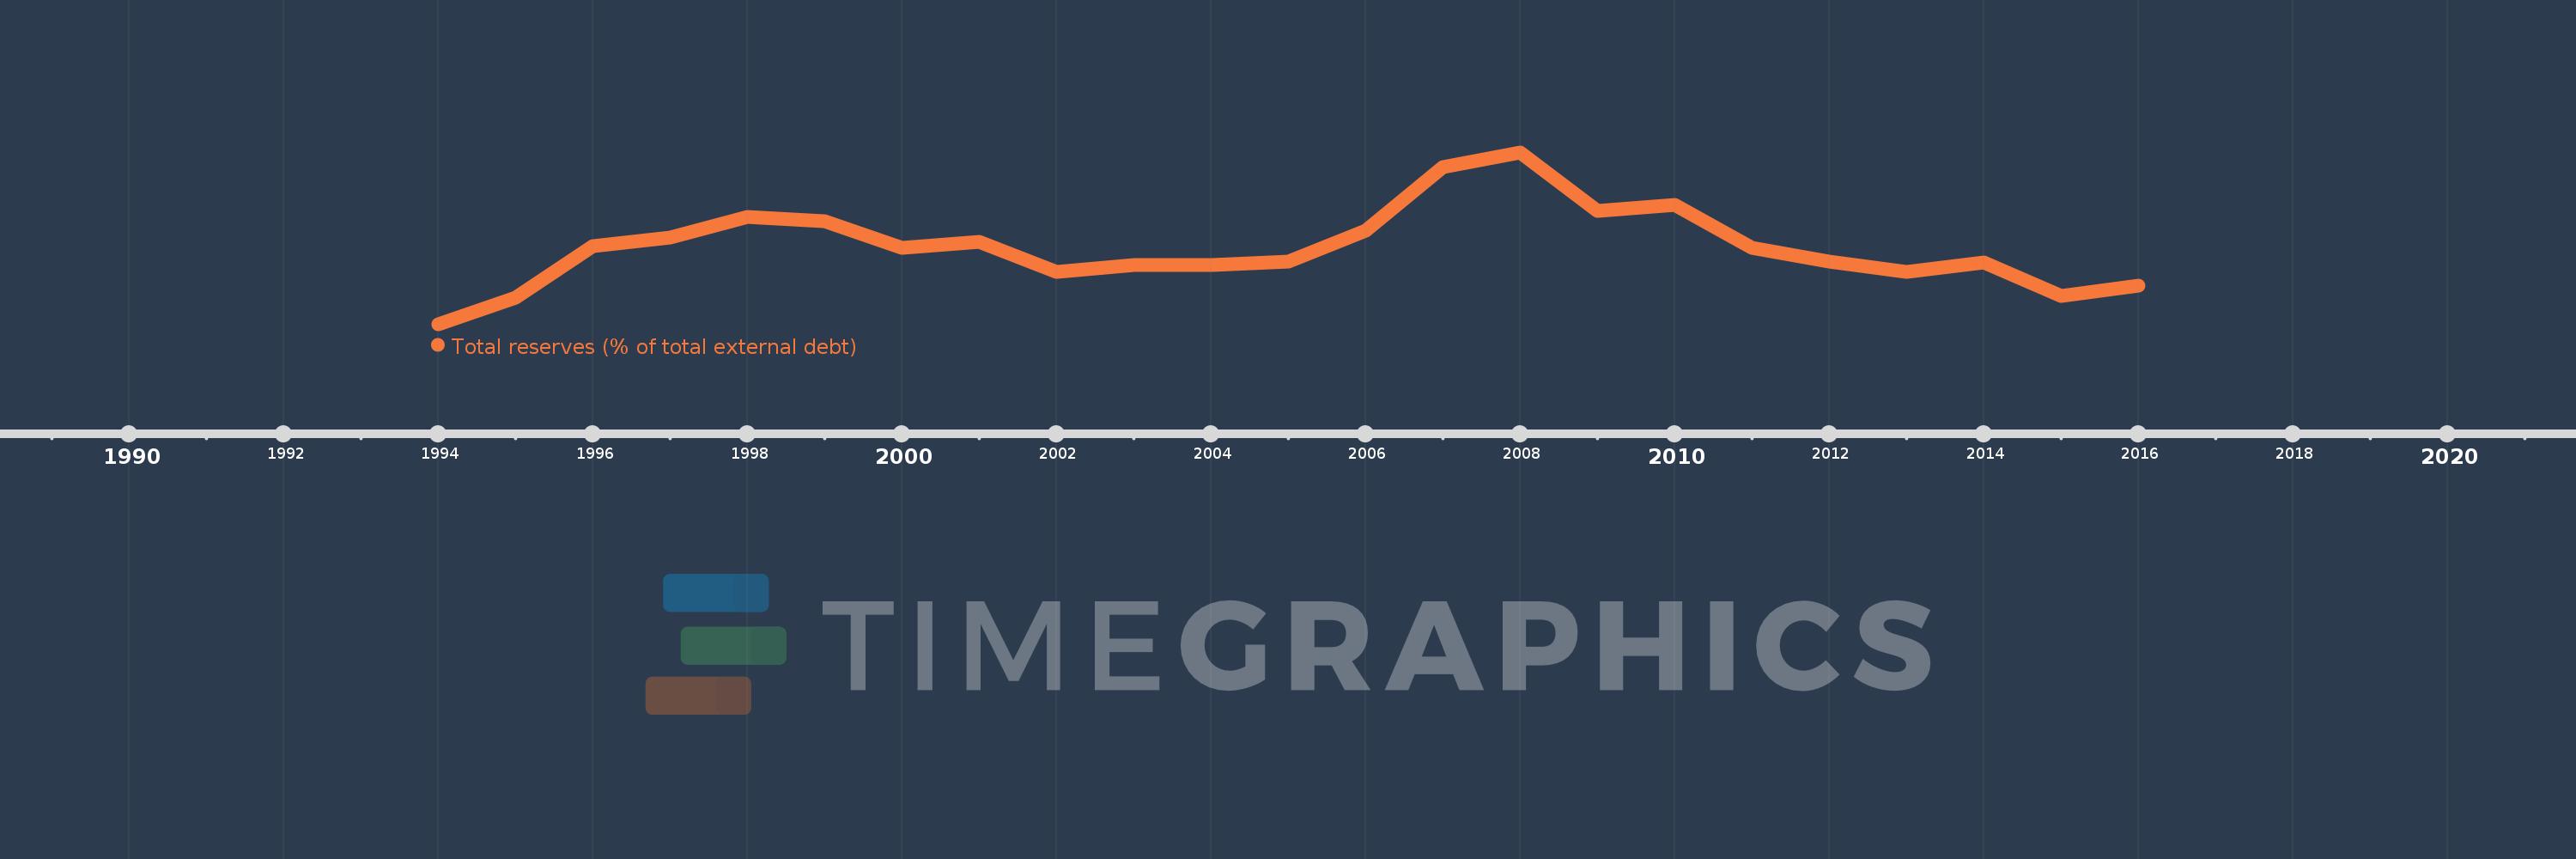
Questa scala temporale mostra un grafico dal 1994 anno al 2016 anno. Armenia. I dati fino ad 1993 anno non disponibili. Il numero di osservazioni attuali secondo i date: 23.

La fonte (nome):

Indicatori dello sviluppo mondiale

La fonte (organizzazione):

World Bank, International Debt Statistics.

Categorie:

Financial Sector, External Debt

sono stati aggiornati

23 apr 2017 anni

Indicatori delle variazioni dei valori per anni

In media:
29.742
Minima:
10.145
1 gen 1994 anni
Massimo:
53.89
1 gen 2008 anni
Alla data di osservazione
Valore
Variazione assoluta
La variazione rispetto al valore precedente
1 gen 1994 anni
10.145
+10.145
0.0%
1 gen 1995 anni
16.847
+6.702
66.06%
1 gen 1996 anni
29.996
+13.149
78.05%
1 gen 1997 anni
32.313
+2.317
7.72%
1 gen 1998 anni
37.468
+5.155
15.95%
1 gen 1999 anni
36.452
-1.016
-2.71%
1 gen 2000 anni
29.681
-6.772
-18.58%
1 gen 2001 anni
31.12
+1.439
4.85%
1 gen 2002 anni
23.517
-7.602
-24.43%
1 gen 2003 anni
25.178
+1.661
7.06%
1 gen 2004 anni
25.171
-0.007
-0.03%
1 gen 2005 anni
26.005
+0.834
3.31%
1 gen 2006 anni
34.018
+8.013
30.81%
1 gen 2007 anni
50.176
+16.158
47.5%
1 gen 2008 anni
53.89
+3.714
7.4%
1 gen 2009 anni
38.978
-14.912
-27.67%
1 gen 2010 anni
40.62
+1.642
4.21%
1 gen 2011 anni
29.595
-11.025
-27.14%
1 gen 2012 anni
26.089
-3.507
-11.85%
1 gen 2013 anni
23.561
-2.527
-9.69%
1 gen 2014 anni
25.948
+2.386
10.13%
1 gen 2015 anni
17.418
-8.529
-32.87%
1 gen 2016 anni
19.891
+2.473
14.2%

Classificazione dei paesi secondo i statistiche attuali per anni