29
/it/
it
AIzaSyAYiBZKx7MnpbEhh9jyipgxe19OcubqV5w
April 1, 2024
47809
Lower middle income
LMC
false
2
1
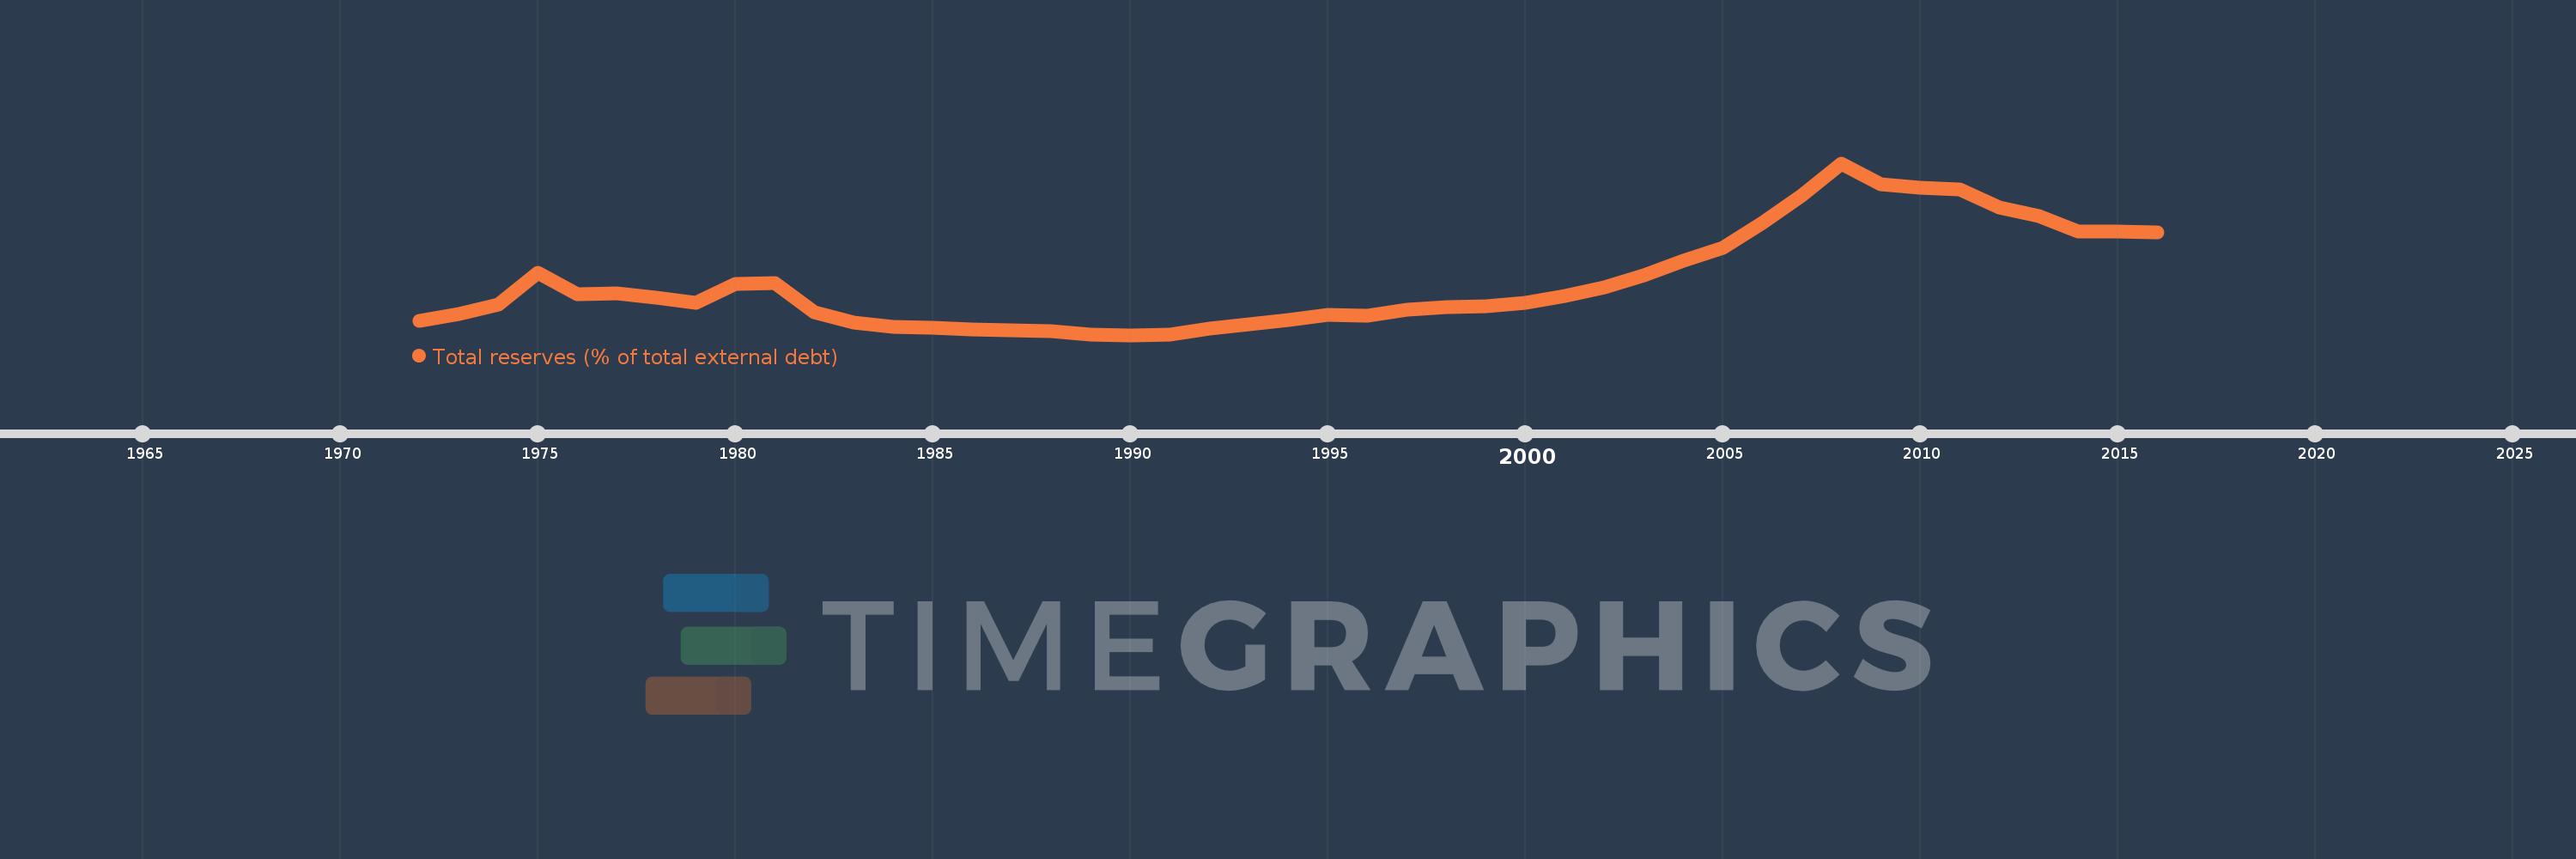
Total reserves (% of total external debt)
2016,2015,2014,2013,2012,2011,2010,2009,2008,2007,2006,2005,2004,2003,2002,2001,2000,1999,1998,1997,1996,1995,1994,1993,1992,1991,1990,1989,1988,1987,1986,1985,1984,1983,1982,1981,1980,1979,1978,1977,1976,1975,1974,1973,1972
Queste statistiche in altri paesi:
Linea del tempo:
Questa scala temporale mostra un grafico dal 1972 anno al 2016 anno. Lower middle income. I dati fino ad 1971 anno non disponibili. Il numero di osservazioni attuali secondo i date: 45.
La fonte (nome):
Indicatori dello sviluppo mondiale
La fonte (organizzazione):
World Bank, International Debt Statistics.
Categorie:
Financial Sector, External Debt
sono stati aggiornati
23 apr 2017 anni
Indicatori delle variazioni dei valori per anni
Minima:
7.681
1 gen 1990 anni
Massimo:
77.928
1 gen 2008 anni
Alla data di osservazione
Valore
Variazione assoluta
La variazione rispetto al valore precedente
1 gen 1972 anni
13.585
+13.585
0.0%
1 gen 1973 anni
16.356
+2.771
20.4%
1 gen 1974 anni
20.25
+3.895
23.81%
1 gen 1975 anni
33.274
+13.024
64.31%
1 gen 1976 anni
24.306
-8.967
-26.95%
1 gen 1977 anni
24.57
+0.264
1.09%
1 gen 1978 anni
22.907
-1.663
-6.77%
1 gen 1979 anni
20.897
-2.01
-8.78%
1 gen 1980 anni
28.542
+7.644
36.58%
1 gen 1981 anni
28.764
+0.222
0.78%
1 gen 1982 anni
16.952
-11.812
-41.06%
1 gen 1983 anni
12.751
-4.201
-24.78%
1 gen 1984 anni
11.14
-1.611
-12.63%
1 gen 1985 anni
10.838
-0.302
-2.71%
1 gen 1986 anni
10.106
-0.732
-6.75%
1 gen 1987 anni
9.501
-0.605
-5.99%
1 gen 1988 anni
9.156
-0.345
-3.63%
1 gen 1989 anni
7.798
-1.358
-14.83%
1 gen 1990 anni
7.681
-0.117
-1.5%
1 gen 1991 anni
7.971
+0.291
3.79%
1 gen 1992 anni
10.372
+2.401
30.12%
1 gen 1993 anni
11.92
+1.548
14.92%
1 gen 1994 anni
13.812
+1.892
15.87%
1 gen 1995 anni
16.08
+2.268
16.42%
1 gen 1996 anni
15.411
-0.67
-4.16%
1 gen 1997 anni
18.171
+2.76
17.91%
1 gen 1998 anni
19.122
+0.951
5.24%
1 gen 1999 anni
19.272
+0.15
0.79%
1 gen 2000 anni
20.961
+1.689
8.76%
1 gen 2001 anni
23.652
+2.69
12.84%
1 gen 2002 anni
27.101
+3.449
14.58%
1 gen 2003 anni
32.187
+5.086
18.77%
1 gen 2004 anni
37.923
+5.736
17.82%
1 gen 2005 anni
43.497
+5.574
14.7%
1 gen 2006 anni
53.596
+10.1
23.22%
1 gen 2007 anni
64.705
+11.109
20.73%
1 gen 2008 anni
77.928
+13.222
20.43%
1 gen 2009 anni
69.232
-8.695
-11.16%
1 gen 2010 anni
67.889
-1.343
-1.94%
1 gen 2011 anni
67.389
-0.5
-0.74%
1 gen 2012 anni
59.701
-7.688
-11.41%
1 gen 2013 anni
56.21
-3.491
-5.85%
1 gen 2014 anni
50.153
-6.057
-10.78%
1 gen 2015 anni
49.841
-0.311
-0.62%
1 gen 2016 anni
49.819
-0.023
-0.05%
Classificazione dei paesi secondo i statistiche attuali per anni


Commenti: