29
/it/
it
AIzaSyAYiBZKx7MnpbEhh9jyipgxe19OcubqV5w
April 1, 2024
203710
Mozambique
MOZ
true
2
1
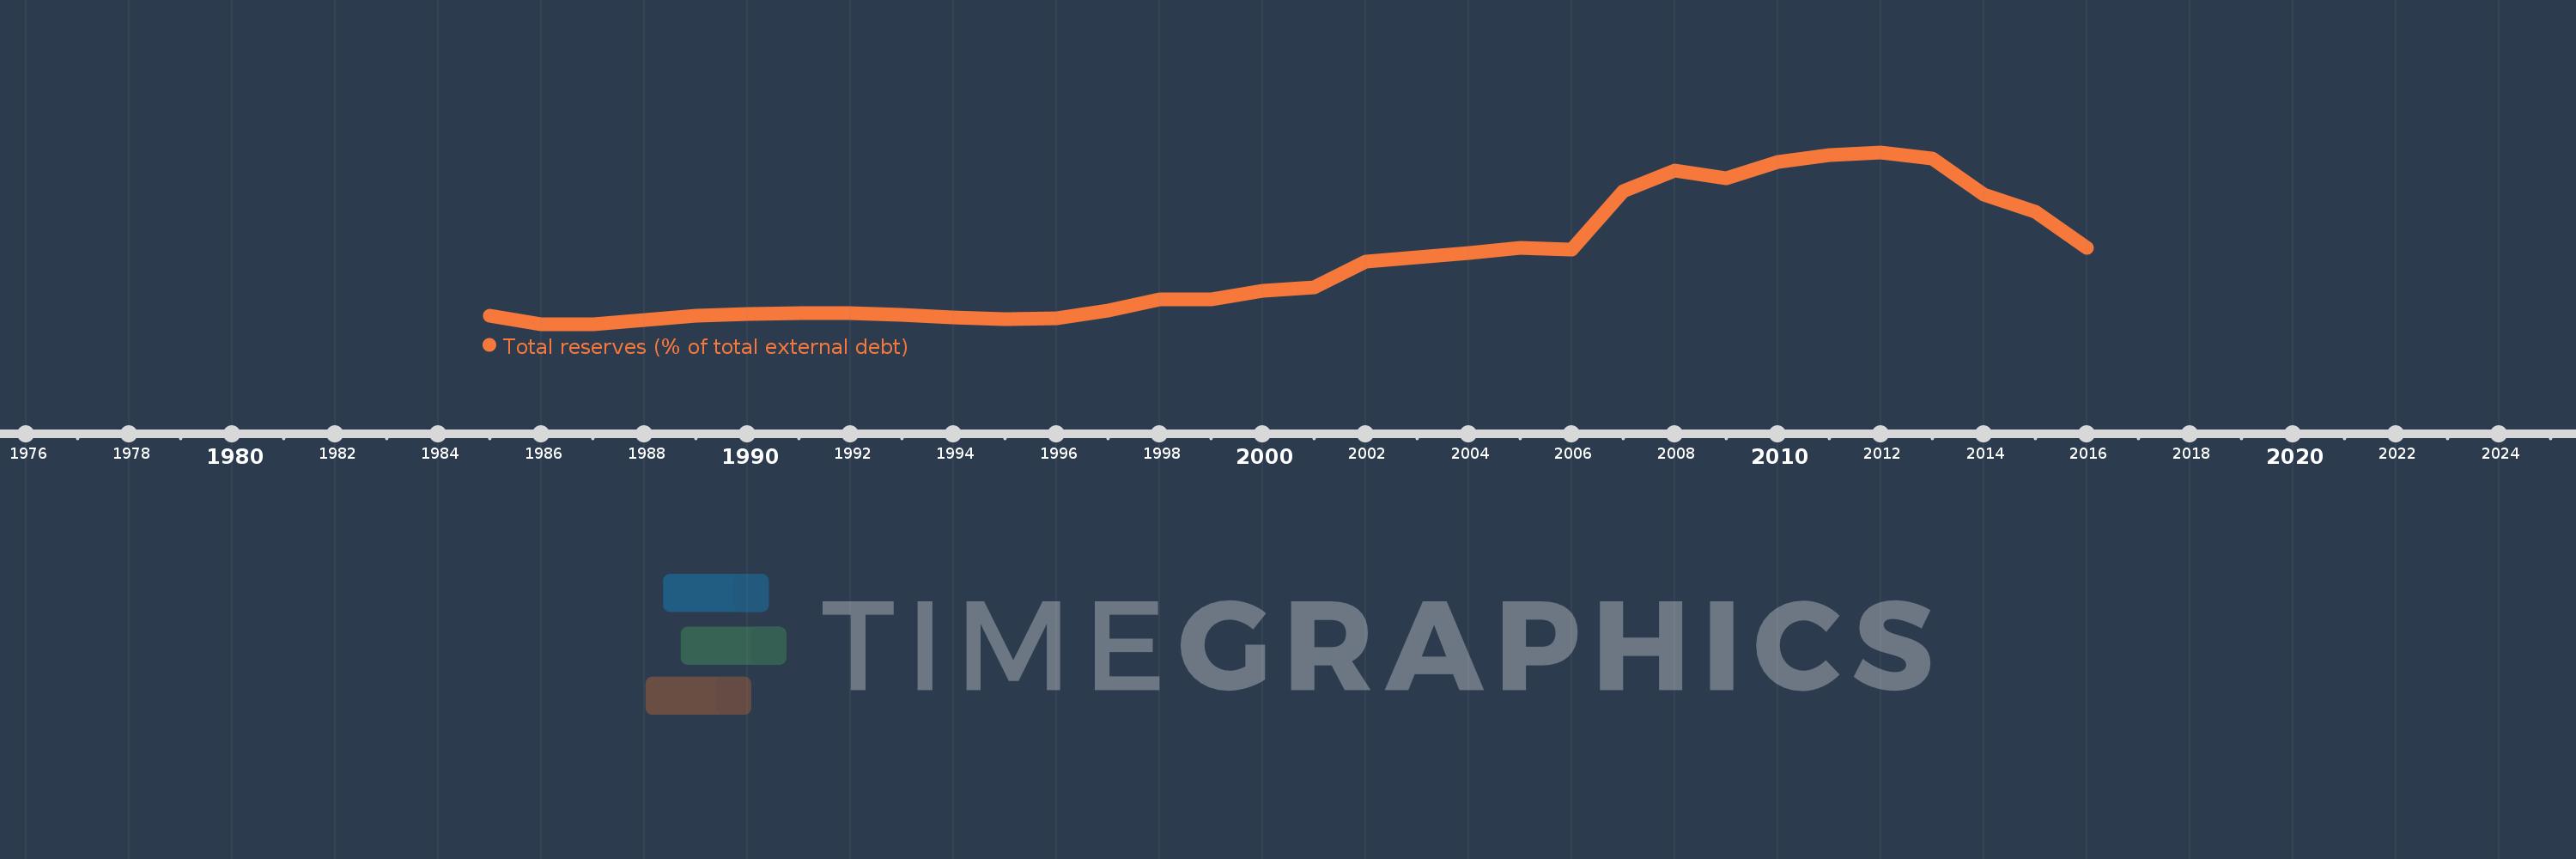
Total reserves (% of total external debt)
2016,2015,2014,2013,2012,2011,2010,2009,2008,2007,2006,2005,2004,2003,2002,2001,2000,1999,1998,1997,1996,1995,1994,1993,1992,1991,1990,1989,1988,1987,1986,1985
Queste statistiche in altri paesi:
Linea del tempo:
Questa scala temporale mostra un grafico dal 1985 anno al 2016 anno. Mozambique. I dati fino ad 1984 anno non disponibili. Il numero di osservazioni attuali secondo i date: 32.
La fonte (nome):
Indicatori dello sviluppo mondiale
La fonte (organizzazione):
World Bank, International Debt Statistics.
Categorie:
Financial Sector, External Debt
sono stati aggiornati
23 apr 2017 anni
Indicatori delle variazioni dei valori per anni
Minima:
1.632
1 gen 1986 anni
Massimo:
55.75
1 gen 2012 anni
Alla data di osservazione
Valore
Variazione assoluta
La variazione rispetto al valore precedente
1 gen 1985 anni
4.194
+4.194
0.0%
1 gen 1986 anni
1.632
-2.562
-61.08%
1 gen 1987 anni
1.653
+0.021
1.26%
1 gen 1988 anni
2.906
+1.254
75.84%
1 gen 1989 anni
4.238
+1.332
45.81%
1 gen 1990 anni
4.73
+0.492
11.61%
1 gen 1991 anni
5.059
+0.329
6.95%
1 gen 1992 anni
5.17
+0.111
2.2%
1 gen 1993 anni
4.608
-0.562
-10.86%
1 gen 1994 anni
3.64
-0.969
-21.02%
1 gen 1995 anni
3.187
-0.453
-12.44%
1 gen 1996 anni
3.463
+0.276
8.67%
1 gen 1997 anni
6.067
+2.603
75.18%
1 gen 1998 anni
9.479
+3.412
56.25%
1 gen 1999 anni
9.587
+0.108
1.14%
1 gen 2000 anni
12.045
+2.459
25.65%
1 gen 2001 anni
13.224
+1.179
9.78%
1 gen 2002 anni
21.306
+8.082
61.12%
1 gen 2003 anni
22.682
+1.376
6.46%
1 gen 2004 anni
24.122
+1.44
6.35%
1 gen 2005 anni
25.633
+1.511
6.26%
1 gen 2006 anni
25.104
-0.529
-2.06%
1 gen 2007 anni
43.561
+18.457
73.52%
1 gen 2008 anni
50.007
+6.446
14.8%
1 gen 2009 anni
47.589
-2.418
-4.84%
1 gen 2010 anni
52.703
+5.114
10.75%
1 gen 2011 anni
54.839
+2.136
4.05%
1 gen 2012 anni
55.75
+0.911
1.66%
1 gen 2013 anni
53.953
-1.797
-3.22%
1 gen 2014 anni
42.472
-11.481
-21.28%
1 gen 2015 anni
37.047
-5.425
-12.77%
1 gen 2016 anni
25.67
-11.378
-30.71%
Classificazione dei paesi secondo i statistiche attuali per anni


Commenti: