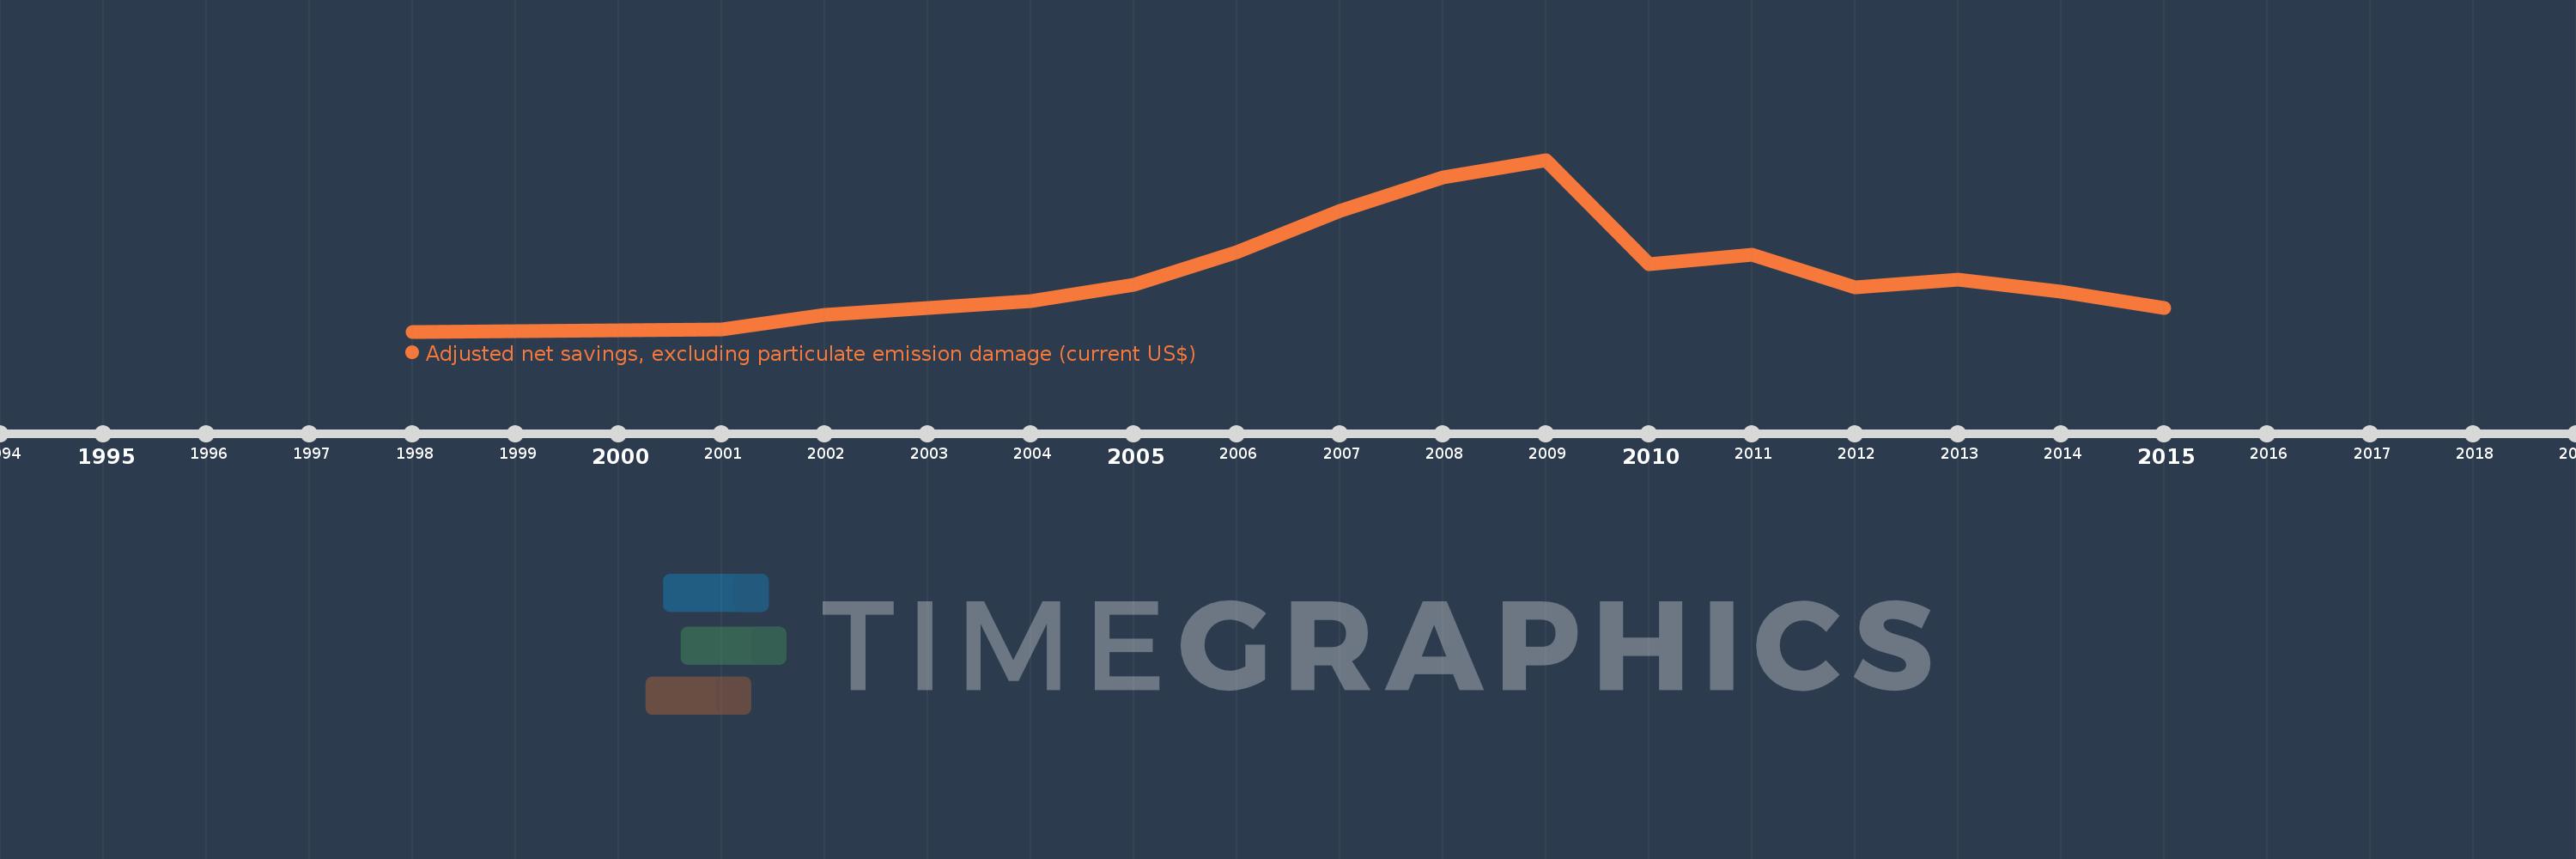
Questa scala temporale mostra un grafico dal 1998 anno al 2015 anno. Armenia. I dati fino ad 1997 anno non disponibili. Il numero di osservazioni attuali secondo i date: 16.
La fonte (nome):
Indicatori dello sviluppo mondiale
La fonte (organizzazione):
World Bank staff estimates based on sources and methods in World Bank's "The Changing Wealth of Nations: Measuring Sustainable Development in the New Millennium" (2011).
Categorie:
Economy & Growth, Environment
sono stati aggiornati
23 apr 2017 anni
Indicatori delle variazioni dei valori per anni
In media:
613.94 Mln
Minima:
-233.089 Mln
1 gen 1998 anni
Massimo:
2.219 Mlrd
1 gen 2009 anni
Alla data di osservazione
Valore
Variazione assoluta
La variazione rispetto al valore precedente
1 gen 1998 anni
-233.089 Mln
-233.089 Mln
0.0%
1 gen 2001 anni
-199.111 Mln
+33.979 Mln
-14.58%
1 gen 2002 anni
2.434 Mln
+201.544 Mln
-101.22%
1 gen 2003 anni
99.711 Mln
+97.277 Mln
4.0 Mille.%
1 gen 2004 anni
199.603 Mln
+99.892 Mln
100.18%
1 gen 2005 anni
431.836 Mln
+232.233 Mln
116.35%
1 gen 2006 anni
897.639 Mln
+465.803 Mln
107.87%
1 gen 2007 anni
1.491 Mlrd
+593.801 Mln
66.15%
1 gen 2008 anni
1.967 Mlrd
+475.092 Mln
31.85%
1 gen 2009 anni
2.219 Mlrd
+251.989 Mln
12.81%
1 gen 2010 anni
735.009 Mln
-1.484 Mlrd
-66.87%
1 gen 2011 anni
860.632 Mln
+125.624 Mln
17.09%
1 gen 2012 anni
404.136 Mln
-456.497 Mln
-53.04%
1 gen 2013 anni
510.423 Mln
+106.287 Mln
26.3%
1 gen 2014 anni
330.939 Mln
-179.484 Mln
-35.16%
1 gen 2015 anni
106.388 Mln
-224.551 Mln
-67.85%
Classificazione dei paesi secondo i statistiche attuali per anni
