29
/it/
it
AIzaSyAYiBZKx7MnpbEhh9jyipgxe19OcubqV5w
April 1, 2024
229376
Russian Federation
RUS
true
2
1
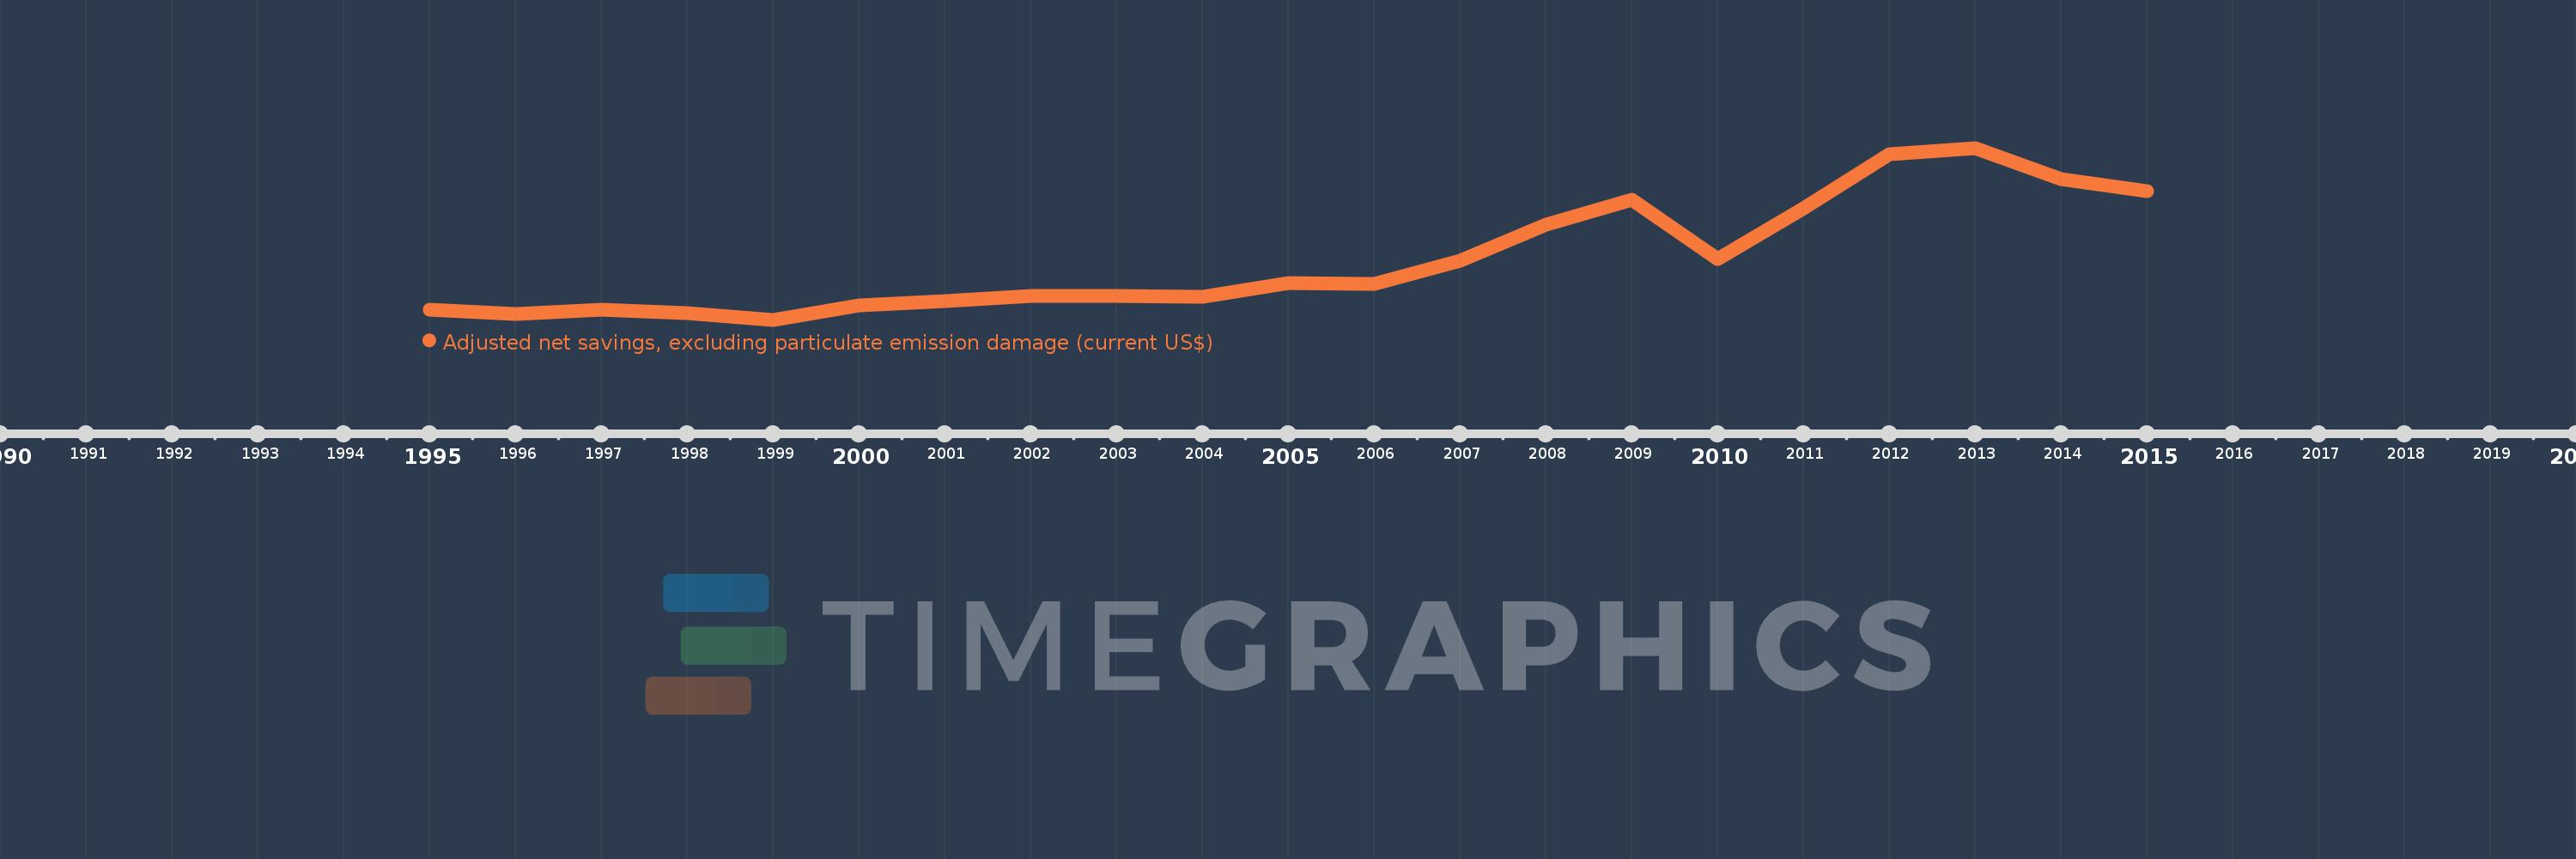
Adjusted net savings, excluding particulate emission damage (current US$)
2015,2014,2013,2012,2011,2010,2009,2008,2007,2006,2005,2004,2003,2002,2001,2000,1999,1998,1997,1996,1995
Queste statistiche in altri paesi:
AfghanistanAlbaniaAlgeriaAngolaArgentinaArmeniaAustraliaAustriaAzerbaijanBahamas, TheBahrainBangladeshBarbadosBelarusBelgiumBelizeBeninBhutanBoliviaBotswanaBrazilBrunei DarussalamBulgariaBurkina FasoBurundiCabo VerdeCambodiaCameroonCanadaCentral African RepublicChadChileChinaColombiaComorosCongo, Dem. Rep.Congo, Rep.Costa RicaCote d'IvoireCroatiaCyprusCzech RepublicDenmarkDjiboutiDominicaDominican RepublicEcuadorEgypt, Arab Rep.El SalvadorEquatorial GuineaEritreaEstoniaEthiopiaFijiFinlandFranceGabonGambia, TheGeorgiaGermanyGhanaGreeceGuatemalaGuineaGuinea-BissauGuyanaHaitiHondurasHungaryIcelandIndiaIndonesiaIran, Islamic Rep.IraqIrelandIsraelItalyJamaicaJapanJordanKazakhstanKenyaKiribatiKorea, Rep.KuwaitKyrgyz RepublicLao PDRLatviaLebanonLesothoLiberiaLibyaLithuaniaLuxembourgMacedonia, FYRMadagascarMalawiMalaysiaMaldivesMaliMauritaniaMauritiusMexicoMoldovaMongoliaMoroccoMozambiqueNamibiaNepalNetherlandsNew ZealandNicaraguaNigerNigeriaNorwayOmanPakistanPanamaPapua New GuineaParaguayPeruPhilippinesPolandPortugalQatarRomaniaRussian FederationRwandaSaudi ArabiaSenegalSeychellesSierra LeoneSingaporeSlovak RepublicSloveniaSolomon IslandsSouth AfricaSpainSri LankaSt. LuciaSt. Vincent and the GrenadinesSudanSurinameSwazilandSwedenSwitzerlandSyrian Arab RepublicTajikistanTanzaniaThailandTogoTongaTrinidad and TobagoTunisiaTurkeyUgandaUkraineUnited KingdomUnited StatesUruguayVanuatuVenezuela, RBVietnamYemen, Rep.ZambiaZimbabwe Linea del tempo:
Questa scala temporale mostra un grafico dal 1995 anno al 2015 anno. Russian Federation. I dati fino ad 1994 anno non disponibili. Il numero di osservazioni attuali secondo i date: 21.
La fonte (nome):
Indicatori dello sviluppo mondiale
La fonte (organizzazione):
World Bank staff estimates based on sources and methods in World Bank's "The Changing Wealth of Nations: Measuring Sustainable Development in the New Millennium" (2011).
Categorie:
Economy & Growth, Environment
sono stati aggiornati
23 apr 2017 anni
Indicatori delle variazioni dei valori per anni
Minima:
-13.121 Mlrd
1 gen 1999 anni
Massimo:
300.031 Mlrd
1 gen 2013 anni
Alla data di osservazione
Valore
Variazione assoluta
La variazione rispetto al valore precedente
1 gen 1995 anni
5.089 Mlrd
+5.089 Mlrd
0.0%
1 gen 1996 anni
-3.364 Mlrd
-8.453 Mlrd
-166.09%
1 gen 1997 anni
5.518 Mlrd
+8.882 Mlrd
-264.06%
1 gen 1998 anni
-557.548 Mln
-6.076 Mlrd
-110.1%
1 gen 1999 anni
-13.121 Mlrd
-12.563 Mlrd
2.25 Mille.%
1 gen 2000 anni
12.886 Mlrd
+26.007 Mlrd
-198.21%
1 gen 2001 anni
21.373 Mlrd
+8.487 Mlrd
65.87%
1 gen 2002 anni
30.056 Mlrd
+8.683 Mlrd
40.62%
1 gen 2003 anni
29.992 Mlrd
-63.825 Mln
-0.21%
1 gen 2004 anni
28.003 Mlrd
-1.989 Mlrd
-6.63%
1 gen 2005 anni
54.157 Mlrd
+26.154 Mlrd
93.4%
1 gen 2006 anni
52.201 Mlrd
-1.956 Mlrd
-3.61%
1 gen 2007 anni
94.959 Mlrd
+42.758 Mlrd
81.91%
1 gen 2008 anni
160.704 Mlrd
+65.744 Mlrd
69.23%
1 gen 2009 anni
205.549 Mlrd
+44.846 Mlrd
27.91%
1 gen 2010 anni
98.157 Mlrd
-107.392 Mlrd
-52.25%
1 gen 2011 anni
189.539 Mlrd
+91.382 Mlrd
93.1%
1 gen 2012 anni
288.035 Mlrd
+98.496 Mlrd
51.97%
1 gen 2013 anni
300.031 Mlrd
+11.997 Mlrd
4.16%
1 gen 2014 anni
242.987 Mlrd
-57.044 Mlrd
-19.01%
1 gen 2015 anni
221.68 Mlrd
-21.307 Mlrd
-8.77%
Classificazione dei paesi secondo i statistiche attuali per anni


Commenti: