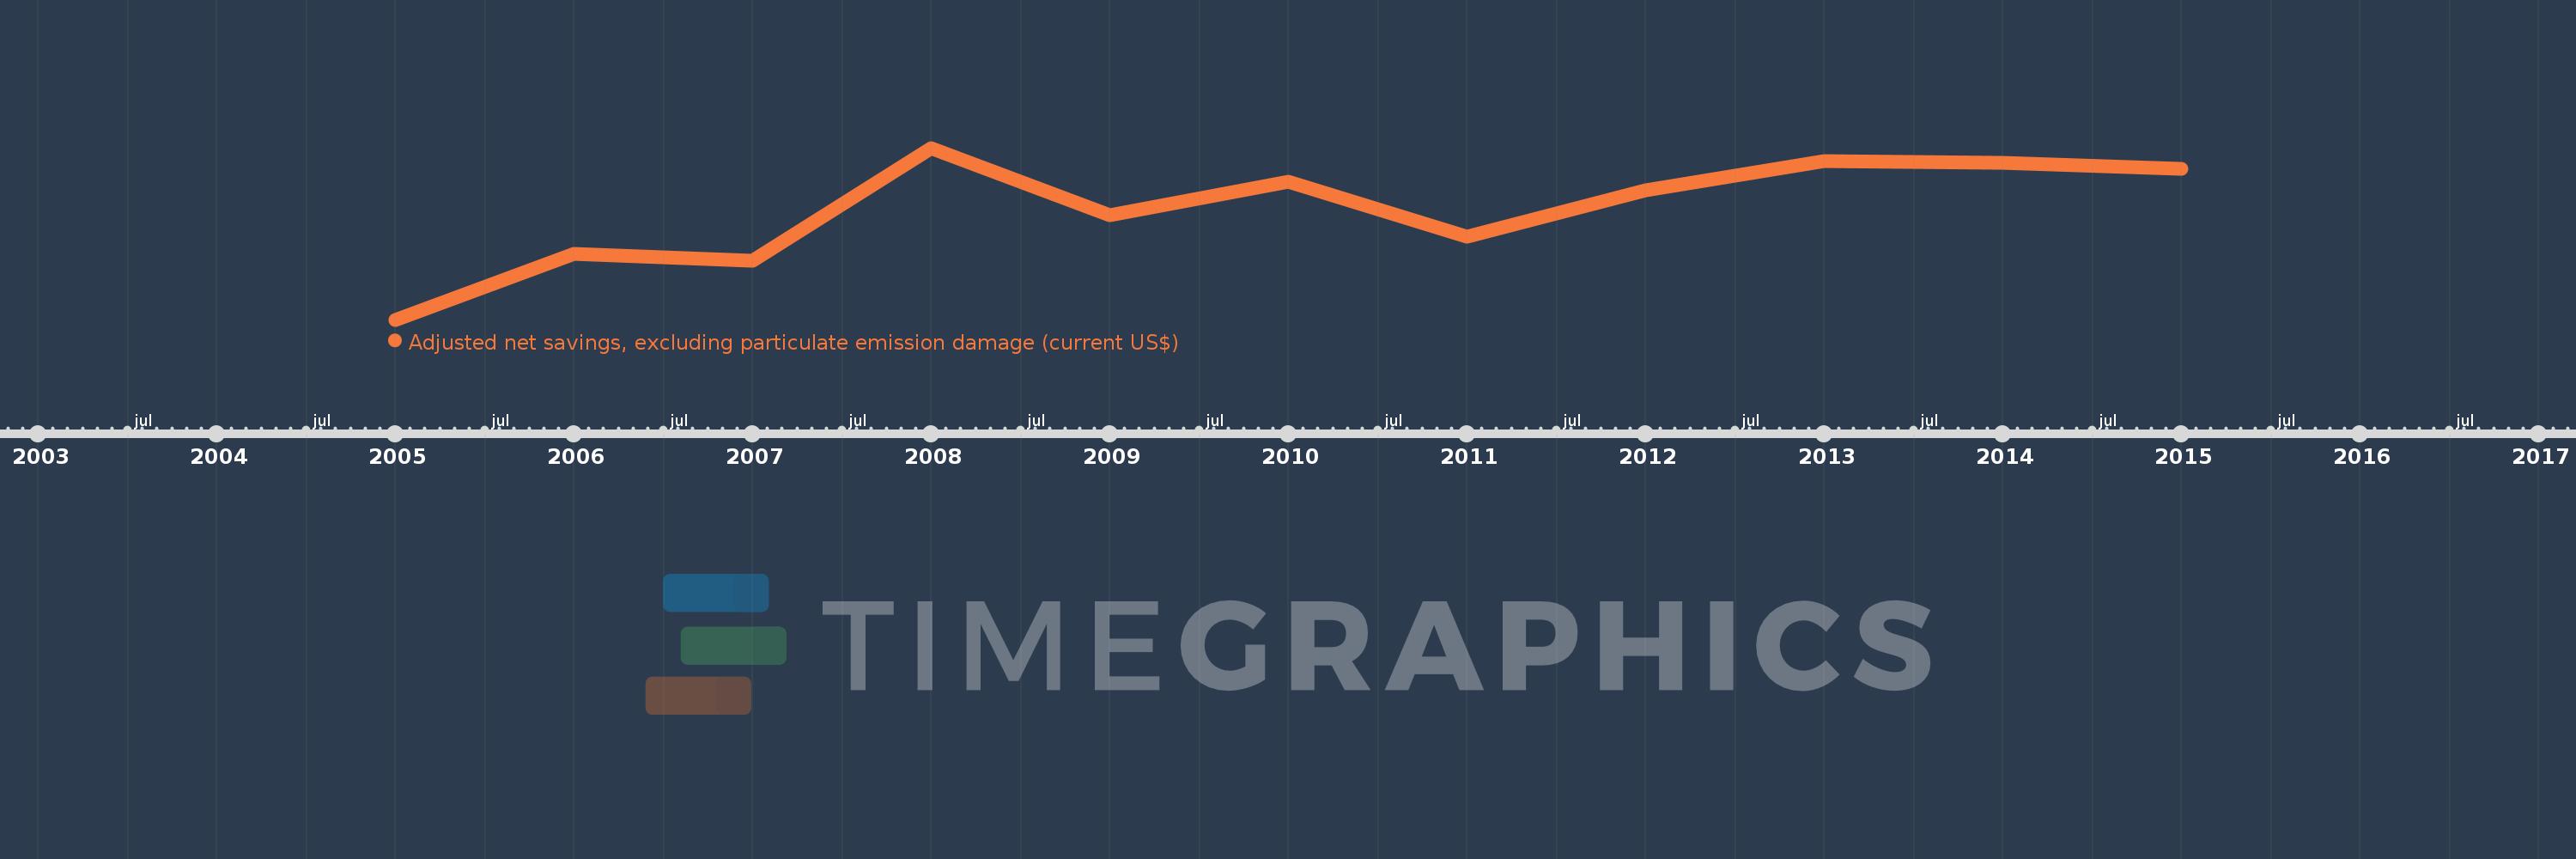
Questa scala temporale mostra un grafico dal 2005 anno al 2015 anno. Haiti. I dati fino ad 2004 anno non disponibili. Il numero di osservazioni attuali secondo i date: 11.
La fonte (nome):
Indicatori dello sviluppo mondiale
La fonte (organizzazione):
World Bank staff estimates based on sources and methods in World Bank's "The Changing Wealth of Nations: Measuring Sustainable Development in the New Millennium" (2011).
Categorie:
Economy & Growth, Environment
sono stati aggiornati
23 apr 2017 anni
Indicatori delle variazioni dei valori per anni
In media:
1.349 Mlrd
Minima:
901.595 Mln
1 gen 2005 anni
Massimo:
1.595 Mlrd
1 gen 2008 anni
Alla data di osservazione
Valore
Variazione assoluta
La variazione rispetto al valore precedente
1 gen 2005 anni
901.595 Mln
+901.595 Mln
0.0%
1 gen 2006 anni
1.169 Mlrd
+267.561 Mln
29.68%
1 gen 2007 anni
1.14 Mlrd
-28.858 Mln
-2.47%
1 gen 2008 anni
1.595 Mlrd
+454.659 Mln
39.87%
1 gen 2009 anni
1.325 Mlrd
-270.241 Mln
-16.94%
1 gen 2010 anni
1.46 Mlrd
+135.058 Mln
10.2%
1 gen 2011 anni
1.238 Mlrd
-221.397 Mln
-15.17%
1 gen 2012 anni
1.422 Mlrd
+183.935 Mln
14.85%
1 gen 2013 anni
1.542 Mlrd
+119.343 Mln
8.39%
1 gen 2014 anni
1.535 Mlrd
-7.019 Mln
-0.46%
1 gen 2015 anni
1.512 Mlrd
-23.019 Mln
-1.5%
Classificazione dei paesi secondo i statistiche attuali per anni
