29
/it/
it
AIzaSyAYiBZKx7MnpbEhh9jyipgxe19OcubqV5w
April 1, 2024
63376
Afghanistan
AFG
true
2
1
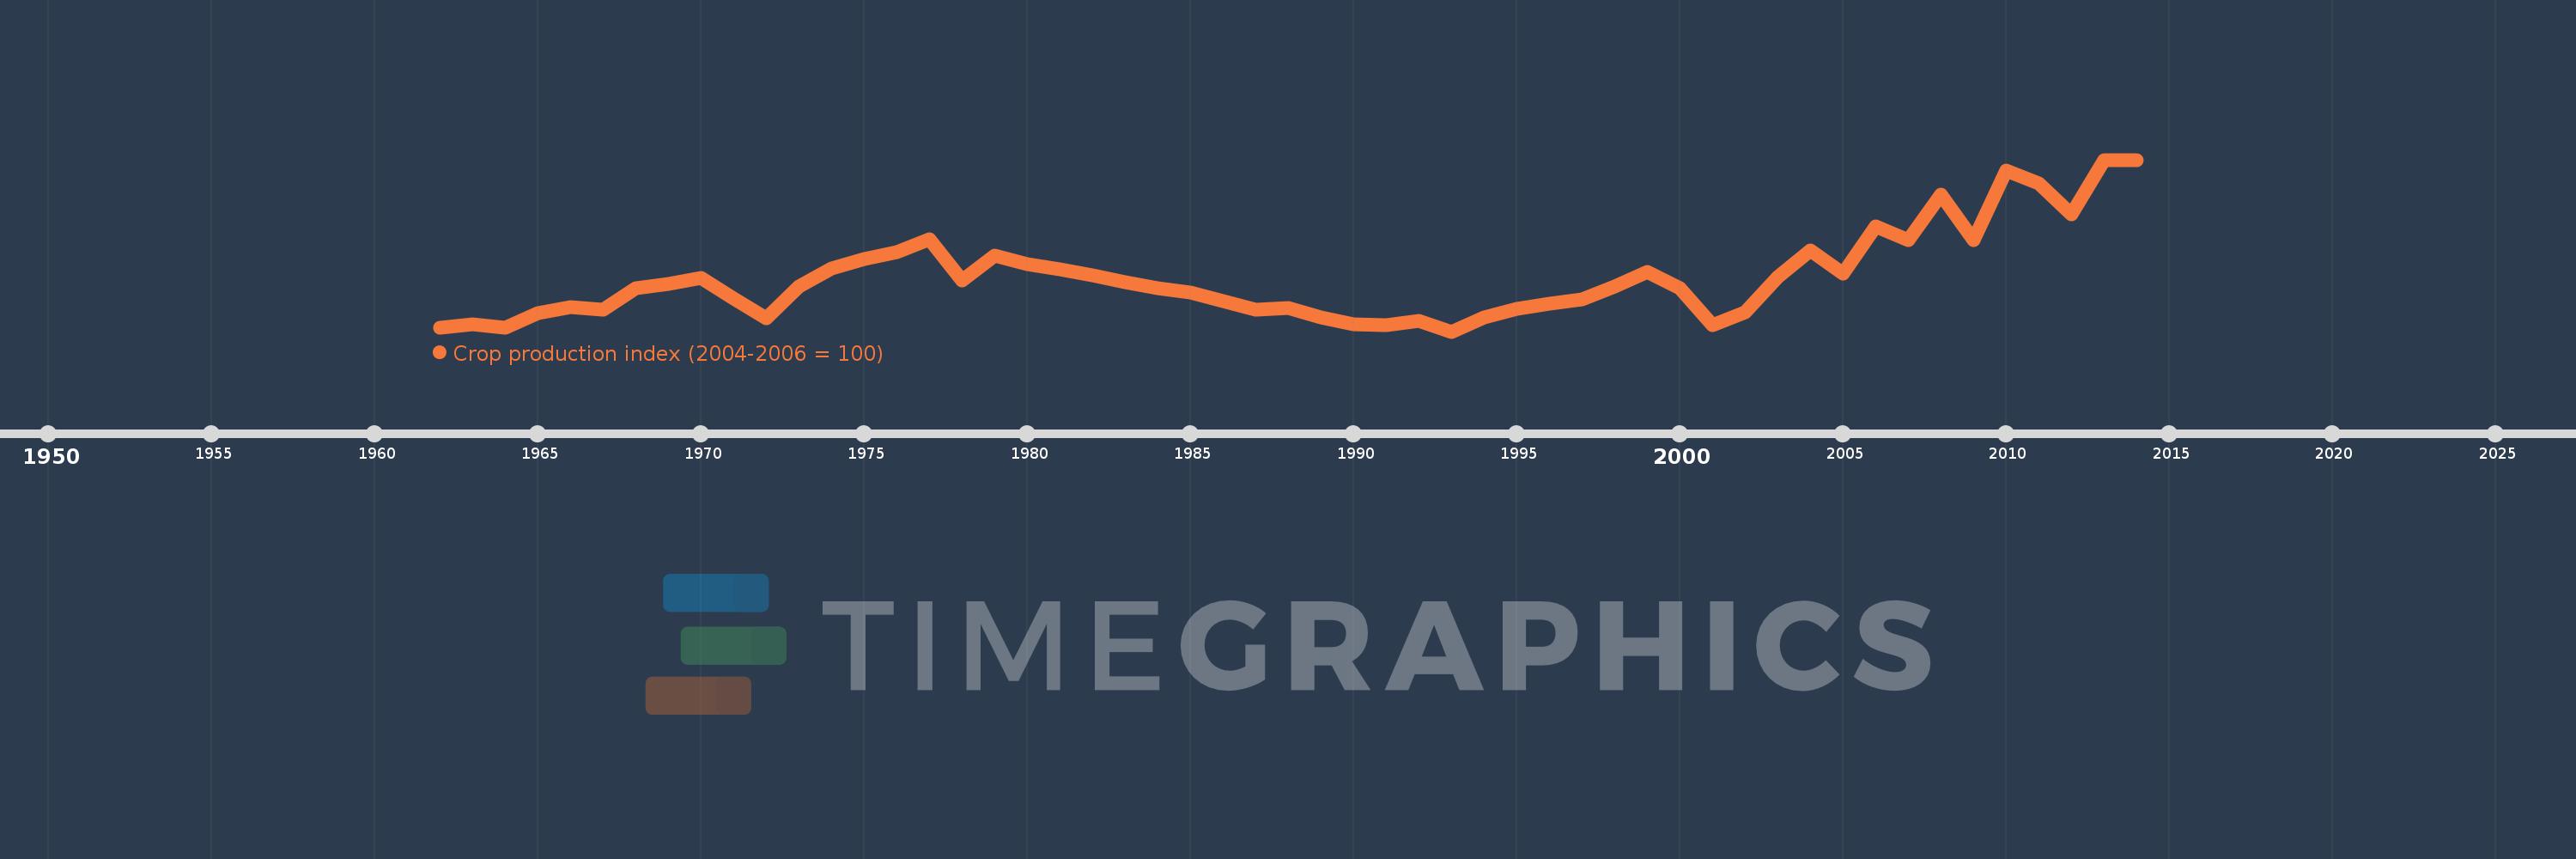
Crop production index (2004-2006 = 100)
2014,2013,2012,2011,2010,2009,2008,2007,2006,2005,2004,2003,2002,2001,2000,1999,1998,1997,1996,1995,1994,1993,1992,1991,1990,1989,1988,1987,1986,1985,1984,1983,1982,1981,1980,1979,1978,1977,1976,1975,1974,1973,1972,1971,1970,1969,1968,1967,1966,1965,1964,1963,1962
Queste statistiche in altri paesi:
AfghanistanAlbaniaAlgeriaAmerican SamoaAngolaAntigua and BarbudaArab WorldArgentinaArmeniaAustraliaAustriaAzerbaijanBahamas, TheBahrainBangladeshBarbadosBelarusBelgiumBelizeBeninBermudaBhutanBoliviaBosnia and HerzegovinaBotswanaBrazilBritish Virgin IslandsBrunei DarussalamBulgariaBurkina FasoBurundiCabo VerdeCambodiaCameroonCanadaCaribbean small statesCayman IslandsCentral African RepublicCentral Europe and the BalticsChadChileChinaColombiaComorosCongo, Dem. Rep.Congo, Rep.Costa RicaCote d'IvoireCroatiaCubaCyprusCzech RepublicDenmarkDjiboutiDominicaDominican RepublicEarly-demographic dividendEast Asia & PacificEast Asia & Pacific (excluding high income)East Asia & Pacific (IDA & IBRD countries)EcuadorEgypt, Arab Rep.El SalvadorEquatorial GuineaEritreaEstoniaEthiopiaEuro areaEurope & Central AsiaEurope & Central Asia (excluding high income)Europe & Central Asia (IDA & IBRD countries)European UnionFaroe IslandsFijiFinlandFragile and conflict affected situationsFranceFrench PolynesiaGabonGambia, TheGeorgiaGermanyGhanaGreeceGrenadaGuamGuatemalaGuineaGuinea-BissauGuyanaHaitiHeavily indebted poor countries (HIPC)High incomeHondurasHong Kong SAR, ChinaHungaryIBRD onlyIcelandIDA & IBRD totalIDA blendIDA onlyIDA totalIndiaIndonesiaIran, Islamic Rep.IraqIrelandIsraelItalyJamaicaJapanJordanKazakhstanKenyaKiribatiKorea, Dem. People’s Rep.Korea, Rep.KuwaitKyrgyz RepublicLao PDRLate-demographic dividendLatin America & Caribbean Latin America & Caribbean (excluding high income)Latin America & the Caribbean (IDA & IBRD countries)LatviaLeast developed countries: UN classificationLebanonLesothoLiberiaLibyaLiechtensteinLithuaniaLow & middle incomeLow incomeLower middle incomeLuxembourgMacao SAR, ChinaMacedonia, FYRMadagascarMalawiMalaysiaMaldivesMaliMaltaMarshall IslandsMauritaniaMauritiusMexicoMicronesia, Fed. Sts.Middle East & North AfricaMiddle East & North Africa (excluding high income)Middle East & North Africa (IDA & IBRD countries)Middle incomeMoldovaMongoliaMontenegroMoroccoMozambiqueMyanmarNamibiaNauruNepalNetherlandsNew CaledoniaNew ZealandNicaraguaNigerNigeriaNorth AmericaNorwayOECD membersOmanOther small statesPacific island small statesPakistanPanamaPapua New GuineaParaguayPeruPhilippinesPolandPortugalPost-demographic dividendPre-demographic dividendPuerto RicoQatarRomaniaRussian FederationRwandaSamoaSao Tome and PrincipeSaudi ArabiaSenegalSerbiaSeychellesSierra LeoneSingaporeSlovak RepublicSloveniaSmall statesSolomon IslandsSomaliaSouth AfricaSouth AsiaSouth Asia (IDA & IBRD)SpainSri LankaSt. Kitts and NevisSt. LuciaSt. Vincent and the GrenadinesSub-Saharan Africa Sub-Saharan Africa (excluding high income)Sub-Saharan Africa (IDA & IBRD countries)SudanSurinameSwazilandSwedenSwitzerlandSyrian Arab RepublicTajikistanTanzaniaThailandTimor-LesteTogoTongaTrinidad and TobagoTunisiaTurkeyTurkmenistanTuvaluUgandaUkraineUnited Arab EmiratesUnited KingdomUnited StatesUpper middle incomeUruguayUzbekistanVanuatuVenezuela, RBVietnamWest Bank and GazaWorldYemen, Rep.ZambiaZimbabwe Linea del tempo:
Questa scala temporale mostra un grafico dal 1962 anno al 2014 anno. Afghanistan. I dati fino ad 1961 anno non disponibili. Il numero di osservazioni attuali secondo i date: 53.
La fonte (nome):
Indicatori dello sviluppo mondiale
La fonte (organizzazione):
Food and Agriculture Organization, electronic files and web site.
Categorie:
Agriculture & Rural Development
sono stati aggiornati
23 apr 2017 anni
Indicatori delle variazioni dei valori per anni
Minima:
65.81
1 gen 1993 anni
Massimo:
134.75
1 gen 2013 anni
Alla data di osservazione
Valore
Variazione assoluta
La variazione rispetto al valore precedente
1 gen 1962 anni
67.38
+67.38
0.0%
1 gen 1963 anni
68.9
+1.52
2.26%
1 gen 1964 anni
67.26
-1.64
-2.38%
1 gen 1965 anni
73.15
+5.89
8.76%
1 gen 1966 anni
75.72
+2.57
3.51%
1 gen 1967 anni
74.45
-1.27
-1.68%
1 gen 1968 anni
83.05
+8.6
11.55%
1 gen 1969 anni
85.05
+2.0
2.41%
1 gen 1970 anni
87.39
+2.34
2.75%
1 gen 1971 anni
79.17
-8.22
-9.41%
1 gen 1972 anni
71.23
-7.94
-10.03%
1 gen 1973 anni
83.94
+12.71
17.84%
1 gen 1974 anni
91.25
+7.31
8.71%
1 gen 1975 anni
94.92
+3.67
4.02%
1 gen 1976 anni
97.68
+2.76
2.91%
1 gen 1977 anni
102.93
+5.25
5.37%
1 gen 1978 anni
86.27
-16.66
-16.19%
1 gen 1979 anni
96.17
+9.9
11.48%
1 gen 1980 anni
93.01
-3.16
-3.29%
1 gen 1981 anni
90.77
-2.24
-2.41%
1 gen 1982 anni
88.28
-2.49
-2.74%
1 gen 1983 anni
85.69
-2.59
-2.93%
1 gen 1984 anni
83.35
-2.34
-2.73%
1 gen 1985 anni
81.57
-1.78
-2.14%
1 gen 1986 anni
78.14
-3.43
-4.2%
1 gen 1987 anni
74.67
-3.47
-4.44%
1 gen 1988 anni
75.2
+0.53
0.71%
1 gen 1989 anni
71.58
-3.62
-4.81%
1 gen 1990 anni
68.58
-3.0
-4.19%
1 gen 1991 anni
68.35
-0.23
-0.34%
1 gen 1992 anni
70.27
+1.92
2.81%
1 gen 1993 anni
65.81
-4.46
-6.35%
1 gen 1994 anni
71.38
+5.57
8.46%
1 gen 1995 anni
74.83
+3.45
4.83%
1 gen 1996 anni
76.88
+2.05
2.74%
1 gen 1997 anni
78.77
+1.89
2.46%
1 gen 1998 anni
84.0
+5.23
6.64%
1 gen 1999 anni
89.68
+5.68
6.76%
1 gen 2000 anni
83.11
-6.57
-7.33%
1 gen 2001 anni
68.56
-14.55
-17.51%
1 gen 2002 anni
73.46
+4.9
7.15%
1 gen 2003 anni
87.81
+14.35
19.53%
1 gen 2004 anni
98.55
+10.74
12.23%
1 gen 2005 anni
89.14
-9.41
-9.55%
1 gen 2006 anni
108.19
+19.05
21.37%
1 gen 2007 anni
102.67
-5.52
-5.1%
1 gen 2008 anni
120.9
+18.23
17.76%
1 gen 2009 anni
102.58
-18.32
-15.15%
1 gen 2010 anni
130.29
+27.71
27.01%
1 gen 2011 anni
125.15
-5.14
-3.95%
1 gen 2012 anni
112.85
-12.3
-9.83%
1 gen 2013 anni
134.75
+21.9
19.41%
1 gen 2014 anni
134.48
-0.27
-0.2%
Classificazione dei paesi secondo i statistiche attuali per anni


Commenti: