29
/it/
it
AIzaSyAYiBZKx7MnpbEhh9jyipgxe19OcubqV5w
April 1, 2024
38856
IDA only
IDX
false
2
1
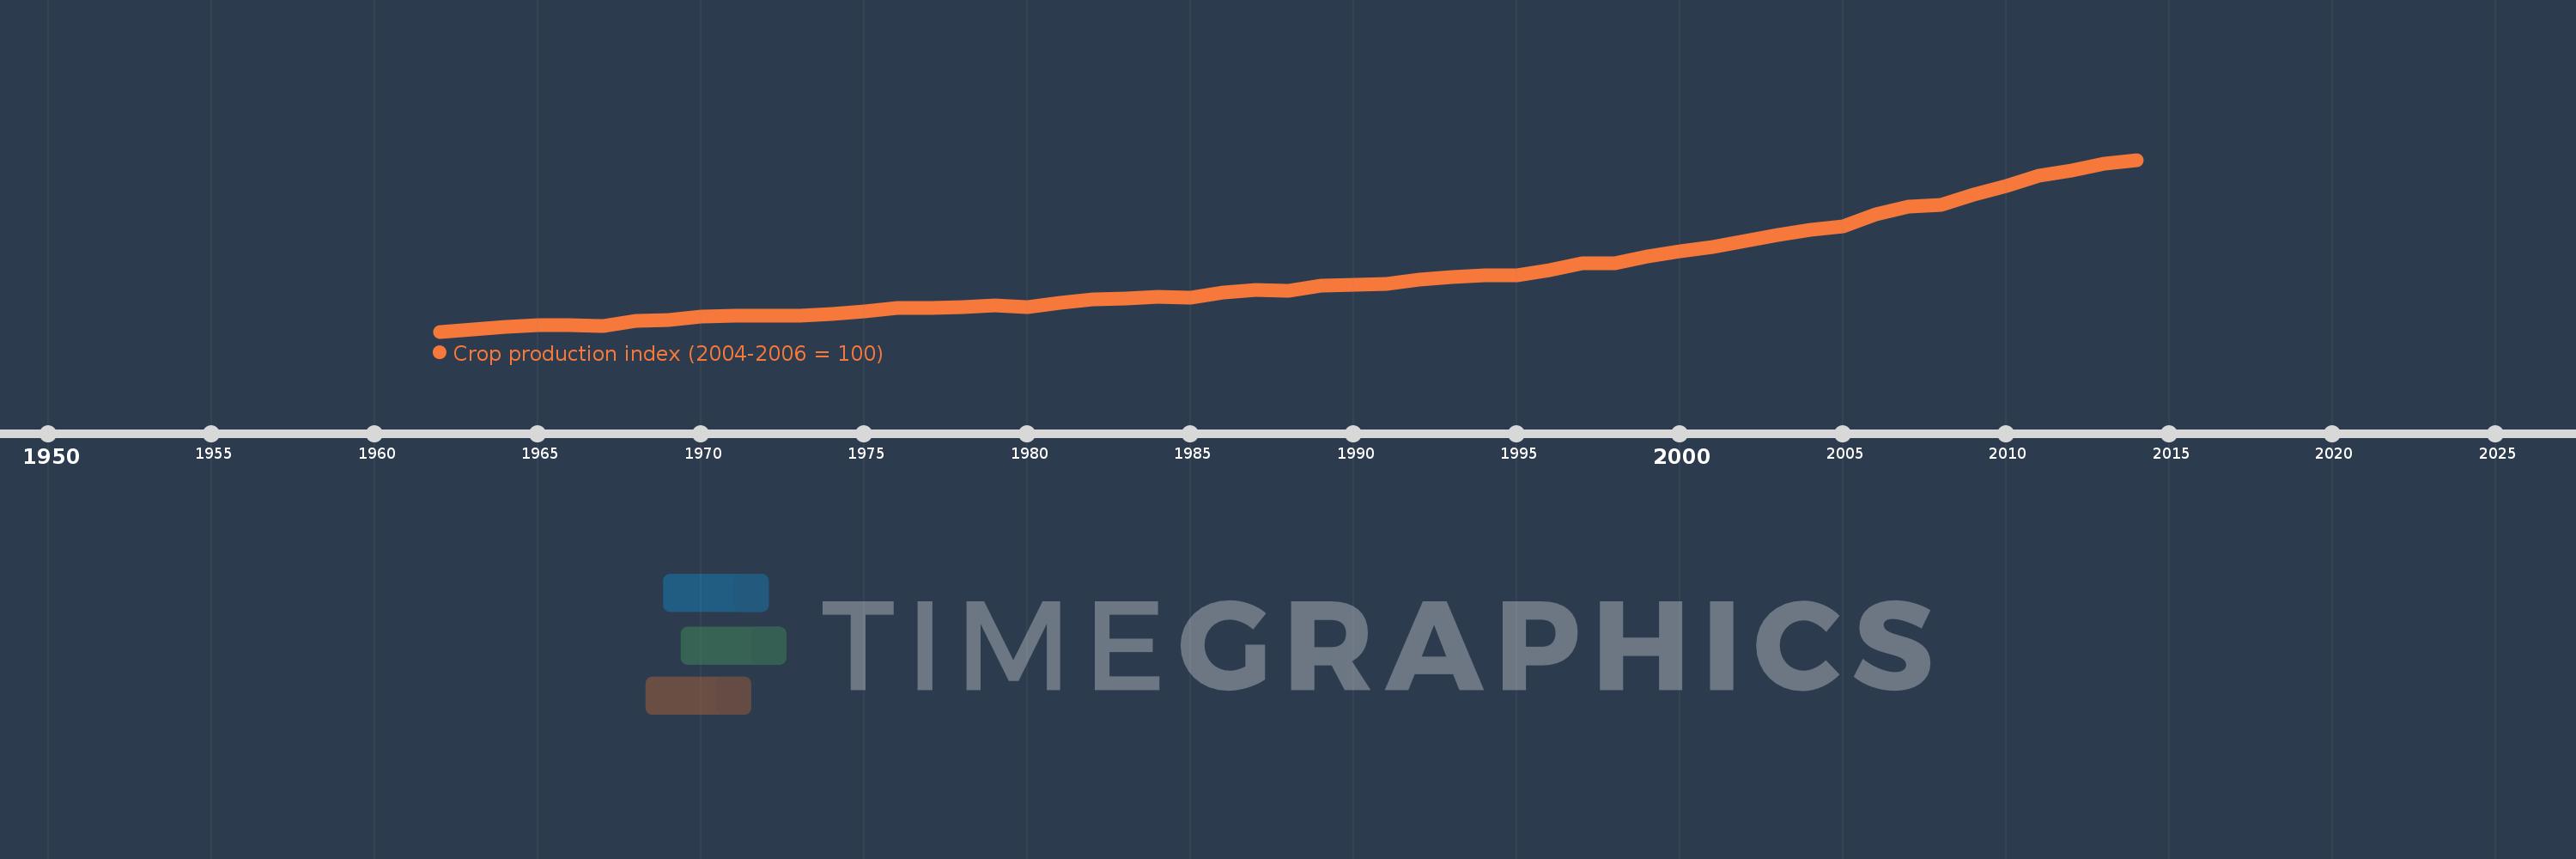
Crop production index (2004-2006 = 100)
2014,2013,2012,2011,2010,2009,2008,2007,2006,2005,2004,2003,2002,2001,2000,1999,1998,1997,1996,1995,1994,1993,1992,1991,1990,1989,1988,1987,1986,1985,1984,1983,1982,1981,1980,1979,1978,1977,1976,1975,1974,1973,1972,1971,1970,1969,1968,1967,1966,1965,1964,1963,1962
Queste statistiche in altri paesi:
AfghanistanAlbaniaAlgeriaAmerican SamoaAngolaAntigua and BarbudaArab WorldArgentinaArmeniaAustraliaAustriaAzerbaijanBahamas, TheBahrainBangladeshBarbadosBelarusBelgiumBelizeBeninBermudaBhutanBoliviaBosnia and HerzegovinaBotswanaBrazilBritish Virgin IslandsBrunei DarussalamBulgariaBurkina FasoBurundiCabo VerdeCambodiaCameroonCanadaCaribbean small statesCayman IslandsCentral African RepublicCentral Europe and the BalticsChadChileChinaColombiaComorosCongo, Dem. Rep.Congo, Rep.Costa RicaCote d'IvoireCroatiaCubaCyprusCzech RepublicDenmarkDjiboutiDominicaDominican RepublicEarly-demographic dividendEast Asia & PacificEast Asia & Pacific (excluding high income)East Asia & Pacific (IDA & IBRD countries)EcuadorEgypt, Arab Rep.El SalvadorEquatorial GuineaEritreaEstoniaEthiopiaEuro areaEurope & Central AsiaEurope & Central Asia (excluding high income)Europe & Central Asia (IDA & IBRD countries)European UnionFaroe IslandsFijiFinlandFragile and conflict affected situationsFranceFrench PolynesiaGabonGambia, TheGeorgiaGermanyGhanaGreeceGrenadaGuamGuatemalaGuineaGuinea-BissauGuyanaHaitiHeavily indebted poor countries (HIPC)High incomeHondurasHong Kong SAR, ChinaHungaryIBRD onlyIcelandIDA & IBRD totalIDA blendIDA onlyIDA totalIndiaIndonesiaIran, Islamic Rep.IraqIrelandIsraelItalyJamaicaJapanJordanKazakhstanKenyaKiribatiKorea, Dem. People’s Rep.Korea, Rep.KuwaitKyrgyz RepublicLao PDRLate-demographic dividendLatin America & Caribbean Latin America & Caribbean (excluding high income)Latin America & the Caribbean (IDA & IBRD countries)LatviaLeast developed countries: UN classificationLebanonLesothoLiberiaLibyaLiechtensteinLithuaniaLow & middle incomeLow incomeLower middle incomeLuxembourgMacao SAR, ChinaMacedonia, FYRMadagascarMalawiMalaysiaMaldivesMaliMaltaMarshall IslandsMauritaniaMauritiusMexicoMicronesia, Fed. Sts.Middle East & North AfricaMiddle East & North Africa (excluding high income)Middle East & North Africa (IDA & IBRD countries)Middle incomeMoldovaMongoliaMontenegroMoroccoMozambiqueMyanmarNamibiaNauruNepalNetherlandsNew CaledoniaNew ZealandNicaraguaNigerNigeriaNorth AmericaNorwayOECD membersOmanOther small statesPacific island small statesPakistanPanamaPapua New GuineaParaguayPeruPhilippinesPolandPortugalPost-demographic dividendPre-demographic dividendPuerto RicoQatarRomaniaRussian FederationRwandaSamoaSao Tome and PrincipeSaudi ArabiaSenegalSerbiaSeychellesSierra LeoneSingaporeSlovak RepublicSloveniaSmall statesSolomon IslandsSomaliaSouth AfricaSouth AsiaSouth Asia (IDA & IBRD)SpainSri LankaSt. Kitts and NevisSt. LuciaSt. Vincent and the GrenadinesSub-Saharan Africa Sub-Saharan Africa (excluding high income)Sub-Saharan Africa (IDA & IBRD countries)SudanSurinameSwazilandSwedenSwitzerlandSyrian Arab RepublicTajikistanTanzaniaThailandTimor-LesteTogoTongaTrinidad and TobagoTunisiaTurkeyTurkmenistanTuvaluUgandaUkraineUnited Arab EmiratesUnited KingdomUnited StatesUpper middle incomeUruguayUzbekistanVanuatuVenezuela, RBVietnamWest Bank and GazaWorldYemen, Rep.ZambiaZimbabwe Linea del tempo:
Questa scala temporale mostra un grafico dal 1962 anno al 2014 anno. IDA only. I dati fino ad 1961 anno non disponibili. Il numero di osservazioni attuali secondo i date: 53.
La fonte (nome):
Indicatori dello sviluppo mondiale
La fonte (organizzazione):
Food and Agriculture Organization, electronic files and web site.
Categorie:
Agriculture & Rural Development
sono stati aggiornati
23 apr 2017 anni
Indicatori delle variazioni dei valori per anni
Minima:
32.192
1 gen 1962 anni
Massimo:
132.852
1 gen 2014 anni
Alla data di osservazione
Valore
Variazione assoluta
La variazione rispetto al valore precedente
1 gen 1962 anni
32.192
+32.192
0.0%
1 gen 1963 anni
33.339
+1.147
3.56%
1 gen 1964 anni
34.789
+1.449
4.35%
1 gen 1965 anni
36.091
+1.303
3.74%
1 gen 1966 anni
35.847
-0.244
-0.68%
1 gen 1967 anni
35.383
-0.464
-1.29%
1 gen 1968 anni
38.489
+3.105
8.78%
1 gen 1969 anni
39.141
+0.652
1.69%
1 gen 1970 anni
40.777
+1.636
4.18%
1 gen 1971 anni
41.418
+0.641
1.57%
1 gen 1972 anni
41.415
-0.003
-0.01%
1 gen 1973 anni
41.453
+0.037
0.09%
1 gen 1974 anni
42.34
+0.887
2.14%
1 gen 1975 anni
44.237
+1.897
4.48%
1 gen 1976 anni
46.108
+1.871
4.23%
1 gen 1977 anni
46.083
-0.026
-0.06%
1 gen 1978 anni
46.29
+0.207
0.45%
1 gen 1979 anni
47.52
+1.23
2.66%
1 gen 1980 anni
46.438
-1.082
-2.28%
1 gen 1981 anni
49.037
+2.599
5.6%
1 gen 1982 anni
50.867
+1.83
3.73%
1 gen 1983 anni
51.643
+0.776
1.53%
1 gen 1984 anni
52.765
+1.121
2.17%
1 gen 1985 anni
52.166
-0.598
-1.13%
1 gen 1986 anni
55.059
+2.892
5.54%
1 gen 1987 anni
56.723
+1.664
3.02%
1 gen 1988 anni
55.909
-0.814
-1.44%
1 gen 1989 anni
58.916
+3.007
5.38%
1 gen 1990 anni
59.416
+0.5
0.85%
1 gen 1991 anni
60.041
+0.625
1.05%
1 gen 1992 anni
62.885
+2.844
4.74%
1 gen 1993 anni
64.088
+1.203
1.91%
1 gen 1994 anni
64.943
+0.855
1.33%
1 gen 1995 anni
65.397
+0.455
0.7%
1 gen 1996 anni
67.949
+2.552
3.9%
1 gen 1997 anni
72.191
+4.242
6.24%
1 gen 1998 anni
72.097
-0.094
-0.13%
1 gen 1999 anni
75.993
+3.896
5.4%
1 gen 2000 anni
79.215
+3.223
4.24%
1 gen 2001 anni
81.575
+2.36
2.98%
1 gen 2002 anni
85.477
+3.902
4.78%
1 gen 2003 anni
88.725
+3.248
3.8%
1 gen 2004 anni
91.941
+3.216
3.62%
1 gen 2005 anni
93.912
+1.971
2.14%
1 gen 2006 anni
100.733
+6.821
7.26%
1 gen 2007 anni
105.355
+4.622
4.59%
1 gen 2008 anni
106.517
+1.162
1.1%
1 gen 2009 anni
112.588
+6.071
5.7%
1 gen 2010 anni
117.414
+4.826
4.29%
1 gen 2011 anni
123.57
+6.156
5.24%
1 gen 2012 anni
126.547
+2.976
2.41%
1 gen 2013 anni
130.655
+4.108
3.25%
1 gen 2014 anni
132.852
+2.197
1.68%
Classificazione dei paesi secondo i statistiche attuali per anni


Commenti: