29
/it/
it
AIzaSyAYiBZKx7MnpbEhh9jyipgxe19OcubqV5w
April 1, 2024
36465
IBRD only
IBD
false
2
1
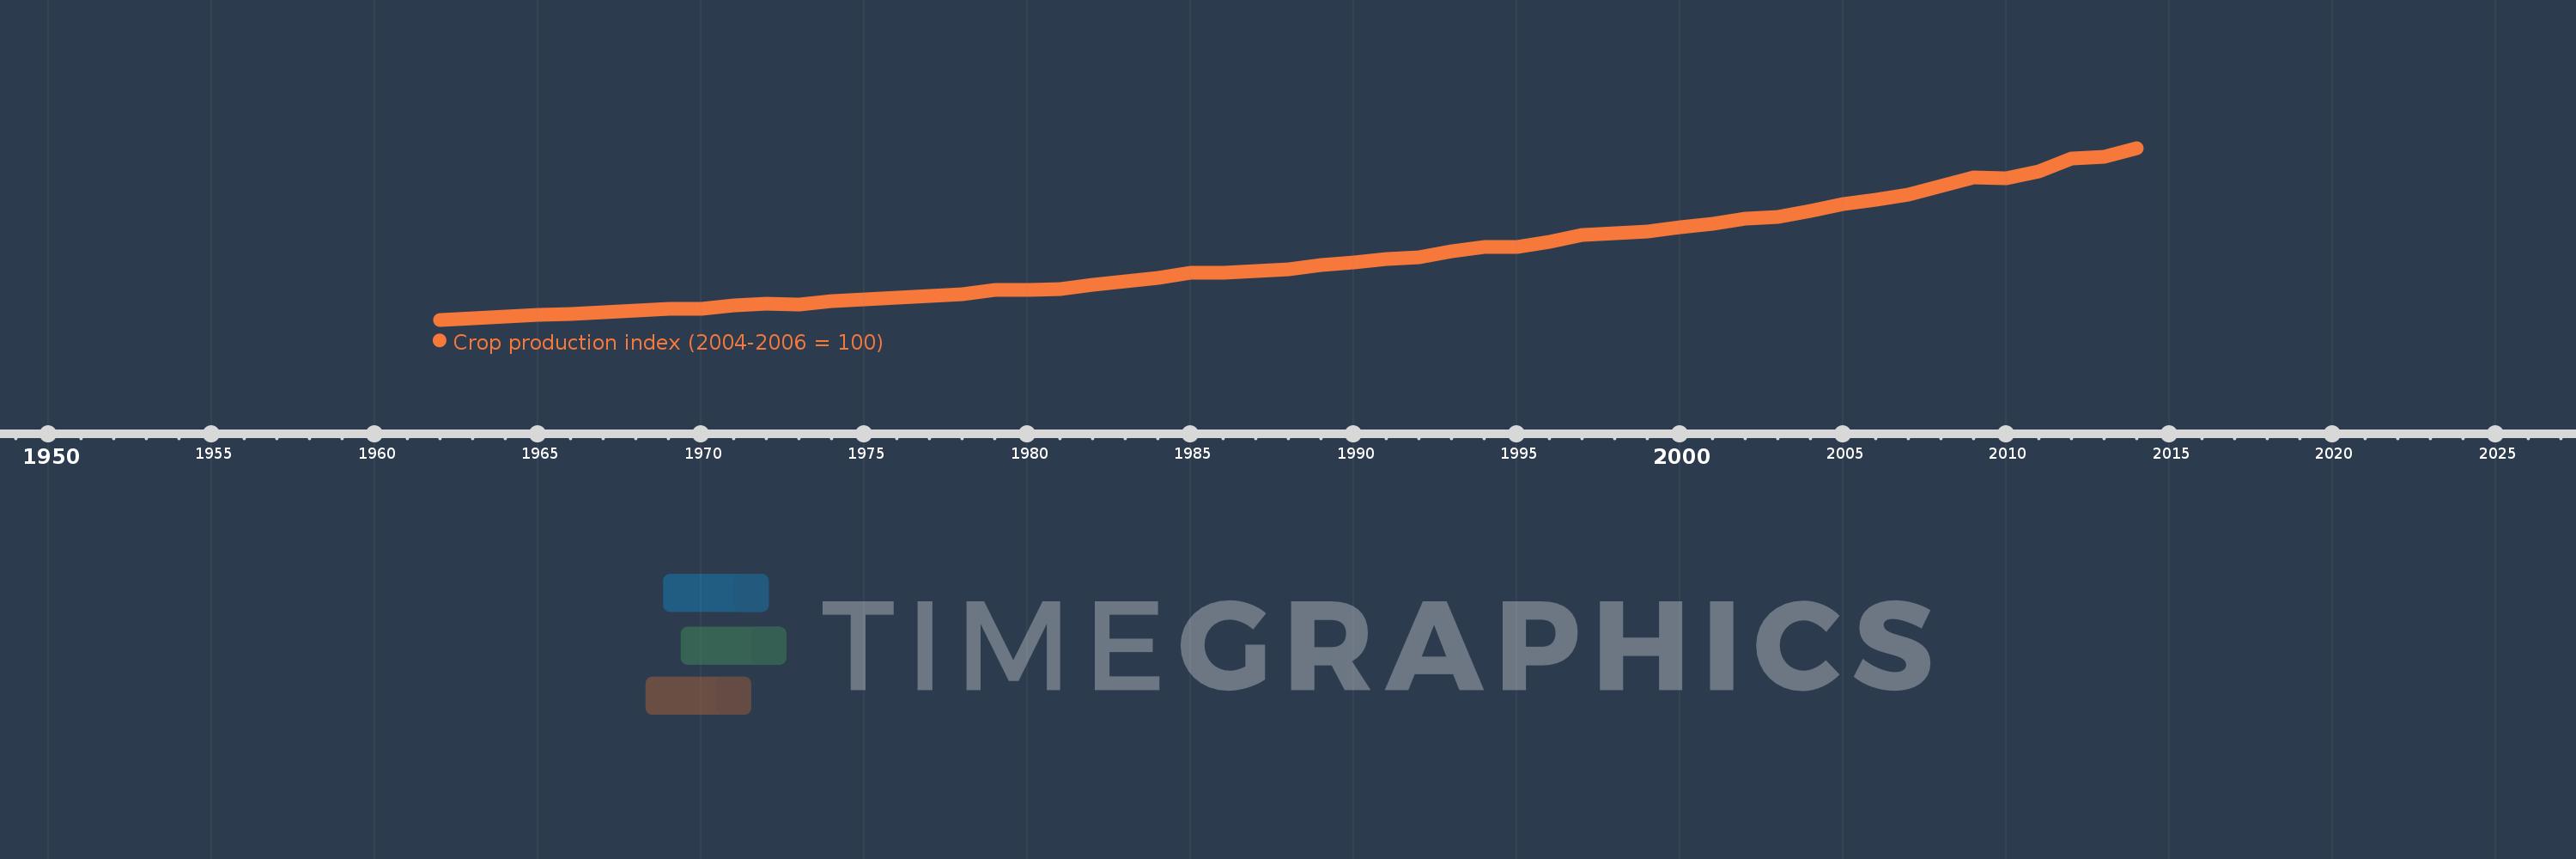
Crop production index (2004-2006 = 100)
2014,2013,2012,2011,2010,2009,2008,2007,2006,2005,2004,2003,2002,2001,2000,1999,1998,1997,1996,1995,1994,1993,1992,1991,1990,1989,1988,1987,1986,1985,1984,1983,1982,1981,1980,1979,1978,1977,1976,1975,1974,1973,1972,1971,1970,1969,1968,1967,1966,1965,1964,1963,1962
Queste statistiche in altri paesi:
AfghanistanAlbaniaAlgeriaAmerican SamoaAngolaAntigua and BarbudaArab WorldArgentinaArmeniaAustraliaAustriaAzerbaijanBahamas, TheBahrainBangladeshBarbadosBelarusBelgiumBelizeBeninBermudaBhutanBoliviaBosnia and HerzegovinaBotswanaBrazilBritish Virgin IslandsBrunei DarussalamBulgariaBurkina FasoBurundiCabo VerdeCambodiaCameroonCanadaCaribbean small statesCayman IslandsCentral African RepublicCentral Europe and the BalticsChadChileChinaColombiaComorosCongo, Dem. Rep.Congo, Rep.Costa RicaCote d'IvoireCroatiaCubaCyprusCzech RepublicDenmarkDjiboutiDominicaDominican RepublicEarly-demographic dividendEast Asia & PacificEast Asia & Pacific (excluding high income)East Asia & Pacific (IDA & IBRD countries)EcuadorEgypt, Arab Rep.El SalvadorEquatorial GuineaEritreaEstoniaEthiopiaEuro areaEurope & Central AsiaEurope & Central Asia (excluding high income)Europe & Central Asia (IDA & IBRD countries)European UnionFaroe IslandsFijiFinlandFragile and conflict affected situationsFranceFrench PolynesiaGabonGambia, TheGeorgiaGermanyGhanaGreeceGrenadaGuamGuatemalaGuineaGuinea-BissauGuyanaHaitiHeavily indebted poor countries (HIPC)High incomeHondurasHong Kong SAR, ChinaHungaryIBRD onlyIcelandIDA & IBRD totalIDA blendIDA onlyIDA totalIndiaIndonesiaIran, Islamic Rep.IraqIrelandIsraelItalyJamaicaJapanJordanKazakhstanKenyaKiribatiKorea, Dem. People’s Rep.Korea, Rep.KuwaitKyrgyz RepublicLao PDRLate-demographic dividendLatin America & Caribbean Latin America & Caribbean (excluding high income)Latin America & the Caribbean (IDA & IBRD countries)LatviaLeast developed countries: UN classificationLebanonLesothoLiberiaLibyaLiechtensteinLithuaniaLow & middle incomeLow incomeLower middle incomeLuxembourgMacao SAR, ChinaMacedonia, FYRMadagascarMalawiMalaysiaMaldivesMaliMaltaMarshall IslandsMauritaniaMauritiusMexicoMicronesia, Fed. Sts.Middle East & North AfricaMiddle East & North Africa (excluding high income)Middle East & North Africa (IDA & IBRD countries)Middle incomeMoldovaMongoliaMontenegroMoroccoMozambiqueMyanmarNamibiaNauruNepalNetherlandsNew CaledoniaNew ZealandNicaraguaNigerNigeriaNorth AmericaNorwayOECD membersOmanOther small statesPacific island small statesPakistanPanamaPapua New GuineaParaguayPeruPhilippinesPolandPortugalPost-demographic dividendPre-demographic dividendPuerto RicoQatarRomaniaRussian FederationRwandaSamoaSao Tome and PrincipeSaudi ArabiaSenegalSerbiaSeychellesSierra LeoneSingaporeSlovak RepublicSloveniaSmall statesSolomon IslandsSomaliaSouth AfricaSouth AsiaSouth Asia (IDA & IBRD)SpainSri LankaSt. Kitts and NevisSt. LuciaSt. Vincent and the GrenadinesSub-Saharan Africa Sub-Saharan Africa (excluding high income)Sub-Saharan Africa (IDA & IBRD countries)SudanSurinameSwazilandSwedenSwitzerlandSyrian Arab RepublicTajikistanTanzaniaThailandTimor-LesteTogoTongaTrinidad and TobagoTunisiaTurkeyTurkmenistanTuvaluUgandaUkraineUnited Arab EmiratesUnited KingdomUnited StatesUpper middle incomeUruguayUzbekistanVanuatuVenezuela, RBVietnamWest Bank and GazaWorldYemen, Rep.ZambiaZimbabwe Linea del tempo:
Questa scala temporale mostra un grafico dal 1962 anno al 2014 anno. IBRD only. I dati fino ad 1961 anno non disponibili. Il numero di osservazioni attuali secondo i date: 53.
La fonte (nome):
Indicatori dello sviluppo mondiale
La fonte (organizzazione):
Food and Agriculture Organization, electronic files and web site.
Categorie:
Agriculture & Rural Development
sono stati aggiornati
23 apr 2017 anni
Indicatori delle variazioni dei valori per anni
Minima:
25.896
1 gen 1962 anni
Massimo:
131.856
1 gen 2014 anni
Alla data di osservazione
Valore
Variazione assoluta
La variazione rispetto al valore precedente
1 gen 1962 anni
25.896
+25.896
0.0%
1 gen 1963 anni
26.547
+0.651
2.51%
1 gen 1964 anni
27.657
+1.11
4.18%
1 gen 1965 anni
28.809
+1.152
4.17%
1 gen 1966 anni
29.62
+0.811
2.82%
1 gen 1967 anni
30.711
+1.09
3.68%
1 gen 1968 anni
31.72
+1.009
3.29%
1 gen 1969 anni
32.523
+0.803
2.53%
1 gen 1970 anni
32.846
+0.323
0.99%
1 gen 1971 anni
34.596
+1.75
5.33%
1 gen 1972 anni
35.811
+1.215
3.51%
1 gen 1973 anni
35.433
-0.377
-1.05%
1 gen 1974 anni
37.534
+2.1
5.93%
1 gen 1975 anni
38.345
+0.812
2.16%
1 gen 1976 anni
39.698
+1.353
3.53%
1 gen 1977 anni
40.336
+0.638
1.61%
1 gen 1978 anni
41.514
+1.178
2.92%
1 gen 1979 anni
44.174
+2.66
6.41%
1 gen 1980 anni
44.215
+0.041
0.09%
1 gen 1981 anni
44.679
+0.464
1.05%
1 gen 1982 anni
47.503
+2.825
6.32%
1 gen 1983 anni
49.321
+1.818
3.83%
1 gen 1984 anni
51.494
+2.173
4.41%
1 gen 1985 anni
54.701
+3.206
6.23%
1 gen 1986 anni
55.135
+0.435
0.79%
1 gen 1987 anni
55.893
+0.758
1.37%
1 gen 1988 anni
56.991
+1.098
1.96%
1 gen 1989 anni
59.445
+2.454
4.31%
1 gen 1990 anni
61.126
+1.681
2.83%
1 gen 1991 anni
63.383
+2.257
3.69%
1 gen 1992 anni
64.271
+0.888
1.4%
1 gen 1993 anni
68.076
+3.805
5.92%
1 gen 1994 anni
70.601
+2.525
3.71%
1 gen 1995 anni
71.032
+0.431
0.61%
1 gen 1996 anni
74.19
+3.158
4.45%
1 gen 1997 anni
77.973
+3.783
5.1%
1 gen 1998 anni
79.201
+1.227
1.57%
1 gen 1999 anni
80.058
+0.857
1.08%
1 gen 2000 anni
82.99
+2.933
3.66%
1 gen 2001 anni
85.118
+2.127
2.56%
1 gen 2002 anni
88.24
+3.122
3.67%
1 gen 2003 anni
89.329
+1.089
1.23%
1 gen 2004 anni
92.943
+3.614
4.05%
1 gen 2005 anni
97.038
+4.095
4.41%
1 gen 2006 anni
99.738
+2.7
2.78%
1 gen 2007 anni
103.212
+3.474
3.48%
1 gen 2008 anni
108.173
+4.961
4.81%
1 gen 2009 anni
113.636
+5.464
5.05%
1 gen 2010 anni
113.155
-0.481
-0.42%
1 gen 2011 anni
117.403
+4.247
3.75%
1 gen 2012 anni
125.393
+7.99
6.81%
1 gen 2013 anni
126.29
+0.897
0.72%
1 gen 2014 anni
131.856
+5.566
4.41%
Classificazione dei paesi secondo i statistiche attuali per anni


Commenti: