29
/it/
it
AIzaSyAYiBZKx7MnpbEhh9jyipgxe19OcubqV5w
April 1, 2024
62706
World
WLD
false
2
1
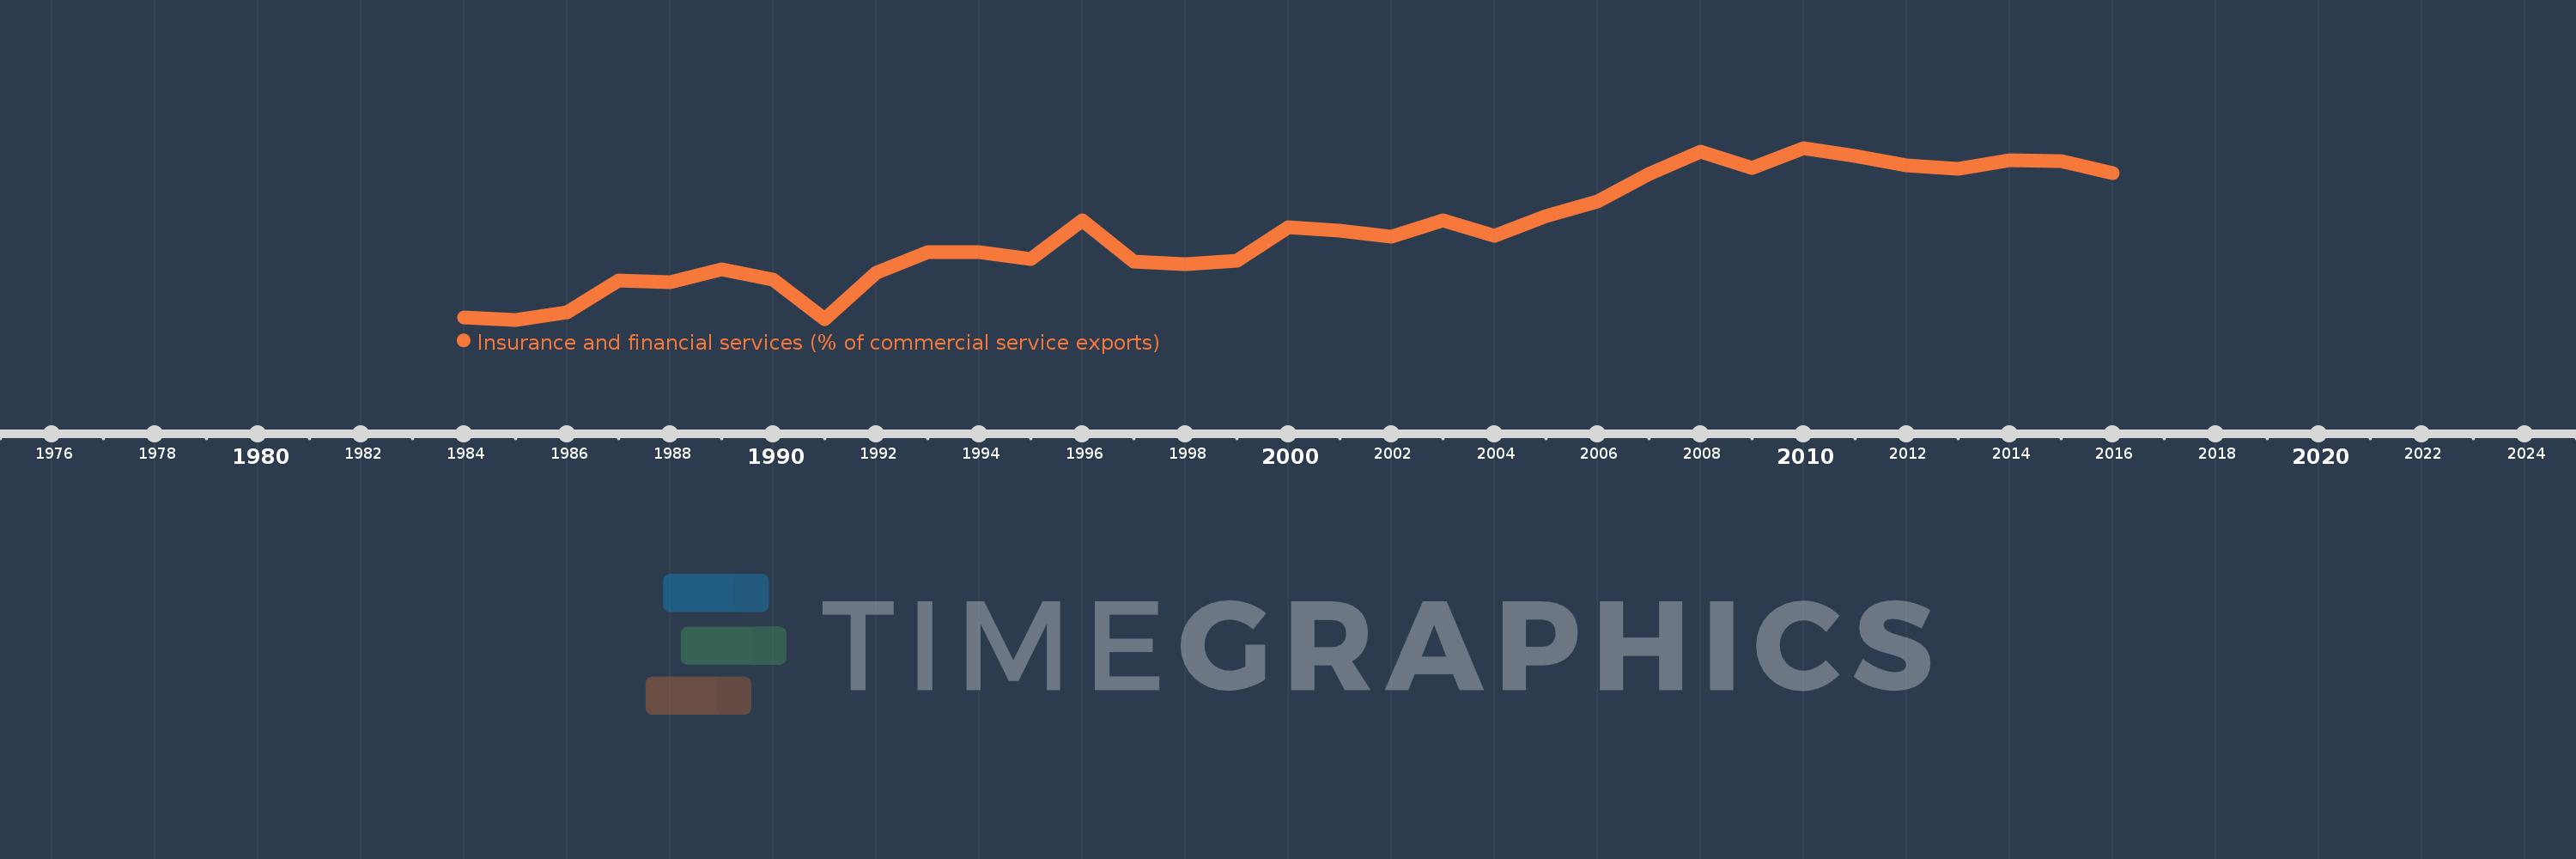
Insurance and financial services (% of commercial service exports)
2016,2015,2014,2013,2012,2011,2010,2009,2008,2007,2006,2005,2004,2003,2002,2001,2000,1999,1998,1997,1996,1995,1994,1993,1992,1991,1990,1989,1988,1987,1986,1985,1984
Queste statistiche in altri paesi:
AfghanistanAlbaniaAlgeriaAngolaAntigua and BarbudaArab WorldArgentinaArmeniaArubaAustraliaAustriaAzerbaijanBahrainBangladeshBarbadosBelarusBelgiumBelizeBeninBermudaBhutanBoliviaBosnia and HerzegovinaBotswanaBrazilBrunei DarussalamBulgariaBurkina FasoBurundiCabo VerdeCambodiaCameroonCanadaCaribbean small statesCentral African RepublicCentral Europe and the BalticsChadChileChinaColombiaComorosCongo, Dem. Rep.Congo, Rep.Costa RicaCote d'IvoireCroatiaCuracaoCyprusCzech RepublicDenmarkDominicaDominican RepublicEarly-demographic dividendEast Asia & PacificEast Asia & Pacific (excluding high income)East Asia & Pacific (IDA & IBRD countries)EcuadorEgypt, Arab Rep.El SalvadorEritreaEstoniaEthiopiaEuro areaEurope & Central AsiaEurope & Central Asia (excluding high income)Europe & Central Asia (IDA & IBRD countries)European UnionFaroe IslandsFijiFinlandFragile and conflict affected situationsFranceFrench PolynesiaGabonGambia, TheGeorgiaGermanyGhanaGreeceGrenadaGuatemalaGuineaGuinea-BissauGuyanaHaitiHeavily indebted poor countries (HIPC)High incomeHondurasHong Kong SAR, ChinaHungaryIBRD onlyIcelandIDA & IBRD totalIDA onlyIDA totalIndiaIndonesiaIran, Islamic Rep.IraqIrelandIsraelItalyJamaicaJapanJordanKazakhstanKenyaKiribatiKorea, Rep.KosovoKuwaitKyrgyz RepublicLao PDRLate-demographic dividendLatin America & Caribbean Latin America & Caribbean (excluding high income)Latin America & the Caribbean (IDA & IBRD countries)LatviaLeast developed countries: UN classificationLebanonLesothoLiberiaLibyaLithuaniaLow & middle incomeLow incomeLower middle incomeLuxembourgMacao SAR, ChinaMacedonia, FYRMadagascarMalawiMalaysiaMaldivesMaliMaltaMauritaniaMauritiusMexicoMiddle East & North AfricaMiddle East & North Africa (excluding high income)Middle East & North Africa (IDA & IBRD countries)Middle incomeMoldovaMongoliaMontenegroMoroccoMozambiqueMyanmarNamibiaNepalNetherlandsNew CaledoniaNew ZealandNicaraguaNigerNigeriaNorth AmericaNorwayOECD membersOmanOther small statesPacific island small statesPakistanPalauPanamaPapua New GuineaParaguayPeruPhilippinesPolandPortugalPost-demographic dividendPre-demographic dividendQatarRomaniaRussian FederationRwandaSamoaSao Tome and PrincipeSaudi ArabiaSenegalSerbiaSeychellesSierra LeoneSingaporeSint Maarten (Dutch part)Slovak RepublicSloveniaSmall statesSolomon IslandsSouth AfricaSouth AsiaSouth Asia (IDA & IBRD)South SudanSpainSri LankaSt. Kitts and NevisSt. LuciaSt. Vincent and the GrenadinesSub-Saharan Africa Sub-Saharan Africa (excluding high income)Sub-Saharan Africa (IDA & IBRD countries)SudanSurinameSwazilandSwedenSwitzerlandSyrian Arab RepublicTajikistanTanzaniaThailandTimor-LesteTogoTongaTrinidad and TobagoTunisiaTurkeyTuvaluUgandaUkraineUnited KingdomUnited StatesUpper middle incomeUruguayVanuatuVenezuela, RBWest Bank and GazaWorldZambiaZimbabwe Linea del tempo:
Questa scala temporale mostra un grafico dal 1984 anno al 2016 anno. World. I dati fino ad 1983 anno non disponibili. Il numero di osservazioni attuali secondo i date: 33.
La fonte (nome):
Indicatori dello sviluppo mondiale
La fonte (organizzazione):
International Monetary Fund, Balance of Payments Statistics Yearbook and data files.
Categorie:
Private Sector, Trade
sono stati aggiornati
23 apr 2017 anni
Indicatori delle variazioni dei valori per anni
Minima:
4.532
1 gen 1985 anni
Massimo:
8.957
1 gen 2010 anni
Alla data di osservazione
Valore
Variazione assoluta
La variazione rispetto al valore precedente
1 gen 1984 anni
4.595
+4.595
0.0%
1 gen 1985 anni
4.532
-0.063
-1.37%
1 gen 1986 anni
4.728
+0.196
4.34%
1 gen 1987 anni
5.55
+0.822
17.38%
1 gen 1988 anni
5.488
-0.062
-1.12%
1 gen 1989 anni
5.837
+0.349
6.35%
1 gen 1990 anni
5.575
-0.261
-4.48%
1 gen 1991 anni
4.553
-1.022
-18.34%
1 gen 1992 anni
5.751
+1.198
26.32%
1 gen 1993 anni
6.276
+0.525
9.12%
1 gen 1994 anni
6.279
+0.003
0.05%
1 gen 1995 anni
6.102
-0.177
-2.83%
1 gen 1996 anni
7.092
+0.99
16.23%
1 gen 1997 anni
6.03
-1.062
-14.98%
1 gen 1998 anni
5.965
-0.064
-1.07%
1 gen 1999 anni
6.055
+0.089
1.5%
1 gen 2000 anni
6.908
+0.854
14.1%
1 gen 2001 anni
6.831
-0.077
-1.12%
1 gen 2002 anni
6.679
-0.152
-2.22%
1 gen 2003 anni
7.087
+0.408
6.1%
1 gen 2004 anni
6.692
-0.395
-5.57%
1 gen 2005 anni
7.193
+0.501
7.49%
1 gen 2006 anni
7.586
+0.393
5.46%
1 gen 2007 anni
8.288
+0.702
9.25%
1 gen 2008 anni
8.86
+0.572
6.91%
1 gen 2009 anni
8.437
-0.423
-4.78%
1 gen 2010 anni
8.957
+0.52
6.16%
1 gen 2011 anni
8.752
-0.206
-2.3%
1 gen 2012 anni
8.501
-0.25
-2.86%
1 gen 2013 anni
8.424
-0.077
-0.91%
1 gen 2014 anni
8.632
+0.208
2.47%
1 gen 2015 anni
8.616
-0.016
-0.18%
1 gen 2016 anni
8.301
-0.316
-3.66%
Classificazione dei paesi secondo i statistiche attuali per anni


Commenti: