29
/it/
it
AIzaSyAYiBZKx7MnpbEhh9jyipgxe19OcubqV5w
April 1, 2024
54142
Pacific island small states
PSS
false
2
1
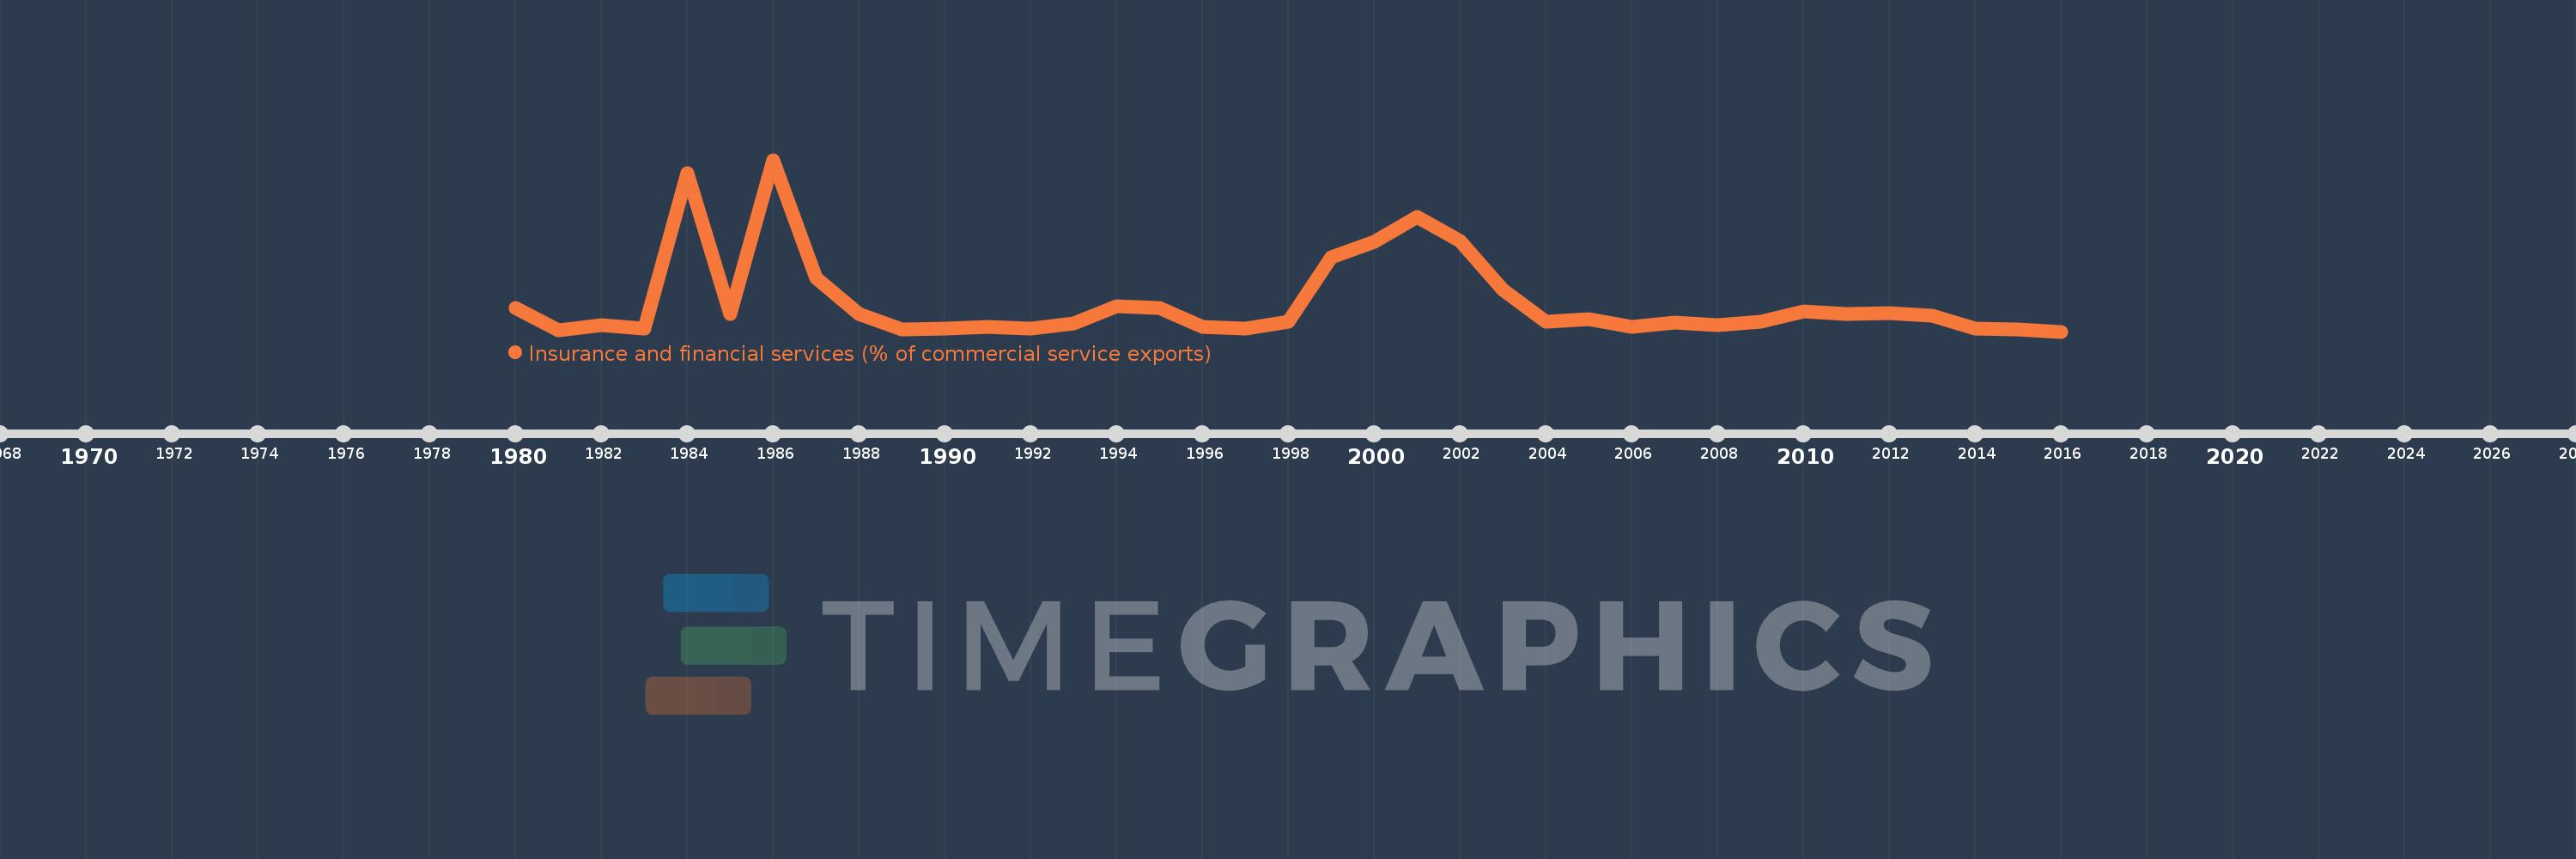
Insurance and financial services (% of commercial service exports)
2016,2015,2014,2013,2012,2011,2010,2009,2008,2007,2006,2005,2004,2003,2002,2001,2000,1999,1998,1997,1996,1995,1994,1993,1992,1991,1990,1989,1988,1987,1986,1985,1984,1983,1982,1981,1980
Queste statistiche in altri paesi:
AfghanistanAlbaniaAlgeriaAngolaAntigua and BarbudaArab WorldArgentinaArmeniaArubaAustraliaAustriaAzerbaijanBahrainBangladeshBarbadosBelarusBelgiumBelizeBeninBermudaBhutanBoliviaBosnia and HerzegovinaBotswanaBrazilBrunei DarussalamBulgariaBurkina FasoBurundiCabo VerdeCambodiaCameroonCanadaCaribbean small statesCentral African RepublicCentral Europe and the BalticsChadChileChinaColombiaComorosCongo, Dem. Rep.Congo, Rep.Costa RicaCote d'IvoireCroatiaCuracaoCyprusCzech RepublicDenmarkDominicaDominican RepublicEarly-demographic dividendEast Asia & PacificEast Asia & Pacific (excluding high income)East Asia & Pacific (IDA & IBRD countries)EcuadorEgypt, Arab Rep.El SalvadorEritreaEstoniaEthiopiaEuro areaEurope & Central AsiaEurope & Central Asia (excluding high income)Europe & Central Asia (IDA & IBRD countries)European UnionFaroe IslandsFijiFinlandFragile and conflict affected situationsFranceFrench PolynesiaGabonGambia, TheGeorgiaGermanyGhanaGreeceGrenadaGuatemalaGuineaGuinea-BissauGuyanaHaitiHeavily indebted poor countries (HIPC)High incomeHondurasHong Kong SAR, ChinaHungaryIBRD onlyIcelandIDA & IBRD totalIDA onlyIDA totalIndiaIndonesiaIran, Islamic Rep.IraqIrelandIsraelItalyJamaicaJapanJordanKazakhstanKenyaKiribatiKorea, Rep.KosovoKuwaitKyrgyz RepublicLao PDRLate-demographic dividendLatin America & Caribbean Latin America & Caribbean (excluding high income)Latin America & the Caribbean (IDA & IBRD countries)LatviaLeast developed countries: UN classificationLebanonLesothoLiberiaLibyaLithuaniaLow & middle incomeLow incomeLower middle incomeLuxembourgMacao SAR, ChinaMacedonia, FYRMadagascarMalawiMalaysiaMaldivesMaliMaltaMauritaniaMauritiusMexicoMiddle East & North AfricaMiddle East & North Africa (excluding high income)Middle East & North Africa (IDA & IBRD countries)Middle incomeMoldovaMongoliaMontenegroMoroccoMozambiqueMyanmarNamibiaNepalNetherlandsNew CaledoniaNew ZealandNicaraguaNigerNigeriaNorth AmericaNorwayOECD membersOmanOther small statesPacific island small statesPakistanPalauPanamaPapua New GuineaParaguayPeruPhilippinesPolandPortugalPost-demographic dividendPre-demographic dividendQatarRomaniaRussian FederationRwandaSamoaSao Tome and PrincipeSaudi ArabiaSenegalSerbiaSeychellesSierra LeoneSingaporeSint Maarten (Dutch part)Slovak RepublicSloveniaSmall statesSolomon IslandsSouth AfricaSouth AsiaSouth Asia (IDA & IBRD)South SudanSpainSri LankaSt. Kitts and NevisSt. LuciaSt. Vincent and the GrenadinesSub-Saharan Africa Sub-Saharan Africa (excluding high income)Sub-Saharan Africa (IDA & IBRD countries)SudanSurinameSwazilandSwedenSwitzerlandSyrian Arab RepublicTajikistanTanzaniaThailandTimor-LesteTogoTongaTrinidad and TobagoTunisiaTurkeyTuvaluUgandaUkraineUnited KingdomUnited StatesUpper middle incomeUruguayVanuatuVenezuela, RBWest Bank and GazaWorldZambiaZimbabwe Linea del tempo:
Questa scala temporale mostra un grafico dal 1980 anno al 2016 anno. Pacific island small states. I dati fino ad 1979 anno non disponibili. Il numero di osservazioni attuali secondo i date: 37.
La fonte (nome):
Indicatori dello sviluppo mondiale
La fonte (organizzazione):
International Monetary Fund, Balance of Payments Statistics Yearbook and data files.
Categorie:
Private Sector, Trade
sono stati aggiornati
23 apr 2017 anni
Indicatori delle variazioni dei valori per anni
Minima:
0.618
1 gen 2016 anni
Massimo:
15.115
1 gen 1986 anni
Alla data di osservazione
Valore
Variazione assoluta
La variazione rispetto al valore precedente
1 gen 1980 anni
2.634
+2.634
0.0%
1 gen 1981 anni
0.76
-1.874
-71.15%
1 gen 1982 anni
1.152
+0.392
51.58%
1 gen 1983 anni
0.889
-0.263
-22.81%
1 gen 1984 anni
14.001
+13.112
1.47 Mille.%
1 gen 1985 anni
2.083
-11.918
-85.13%
1 gen 1986 anni
15.115
+13.032
625.79%
1 gen 1987 anni
5.12
-9.995
-66.12%
1 gen 1988 anni
2.087
-3.033
-59.24%
1 gen 1989 anni
0.808
-1.279
-61.29%
1 gen 1990 anni
0.867
+0.059
7.33%
1 gen 1991 anni
1.012
+0.145
16.7%
1 gen 1992 anni
0.893
-0.119
-11.72%
1 gen 1993 anni
1.334
+0.44
49.27%
1 gen 1994 anni
2.791
+1.457
109.25%
1 gen 1995 anni
2.619
-0.172
-6.17%
1 gen 1996 anni
1.029
-1.589
-60.7%
1 gen 1997 anni
0.881
-0.148
-14.41%
1 gen 1998 anni
1.478
+0.598
67.85%
1 gen 1999 anni
6.86
+5.382
364.02%
1 gen 2000 anni
8.173
+1.312
19.13%
1 gen 2001 anni
10.293
+2.12
25.95%
1 gen 2002 anni
8.253
-2.04
-19.82%
1 gen 2003 anni
4.163
-4.09
-49.56%
1 gen 2004 anni
1.439
-2.724
-65.43%
1 gen 2005 anni
1.669
+0.23
15.98%
1 gen 2006 anni
1.001
-0.668
-40.03%
1 gen 2007 anni
1.39
+0.389
38.87%
1 gen 2008 anni
1.19
-0.201
-14.43%
1 gen 2009 anni
1.43
+0.24
20.2%
1 gen 2010 anni
2.332
+0.902
63.1%
1 gen 2011 anni
2.136
-0.196
-8.41%
1 gen 2012 anni
2.16
+0.024
1.12%
1 gen 2013 anni
1.944
-0.216
-10.0%
1 gen 2014 anni
0.899
-1.045
-53.74%
1 gen 2015 anni
0.79
-0.109
-12.1%
1 gen 2016 anni
0.618
-0.173
-21.84%
Classificazione dei paesi secondo i statistiche attuali per anni


Commenti: