29
/it/
it
AIzaSyAYiBZKx7MnpbEhh9jyipgxe19OcubqV5w
April 1, 2024
216588
Pakistan
PAK
true
2
1
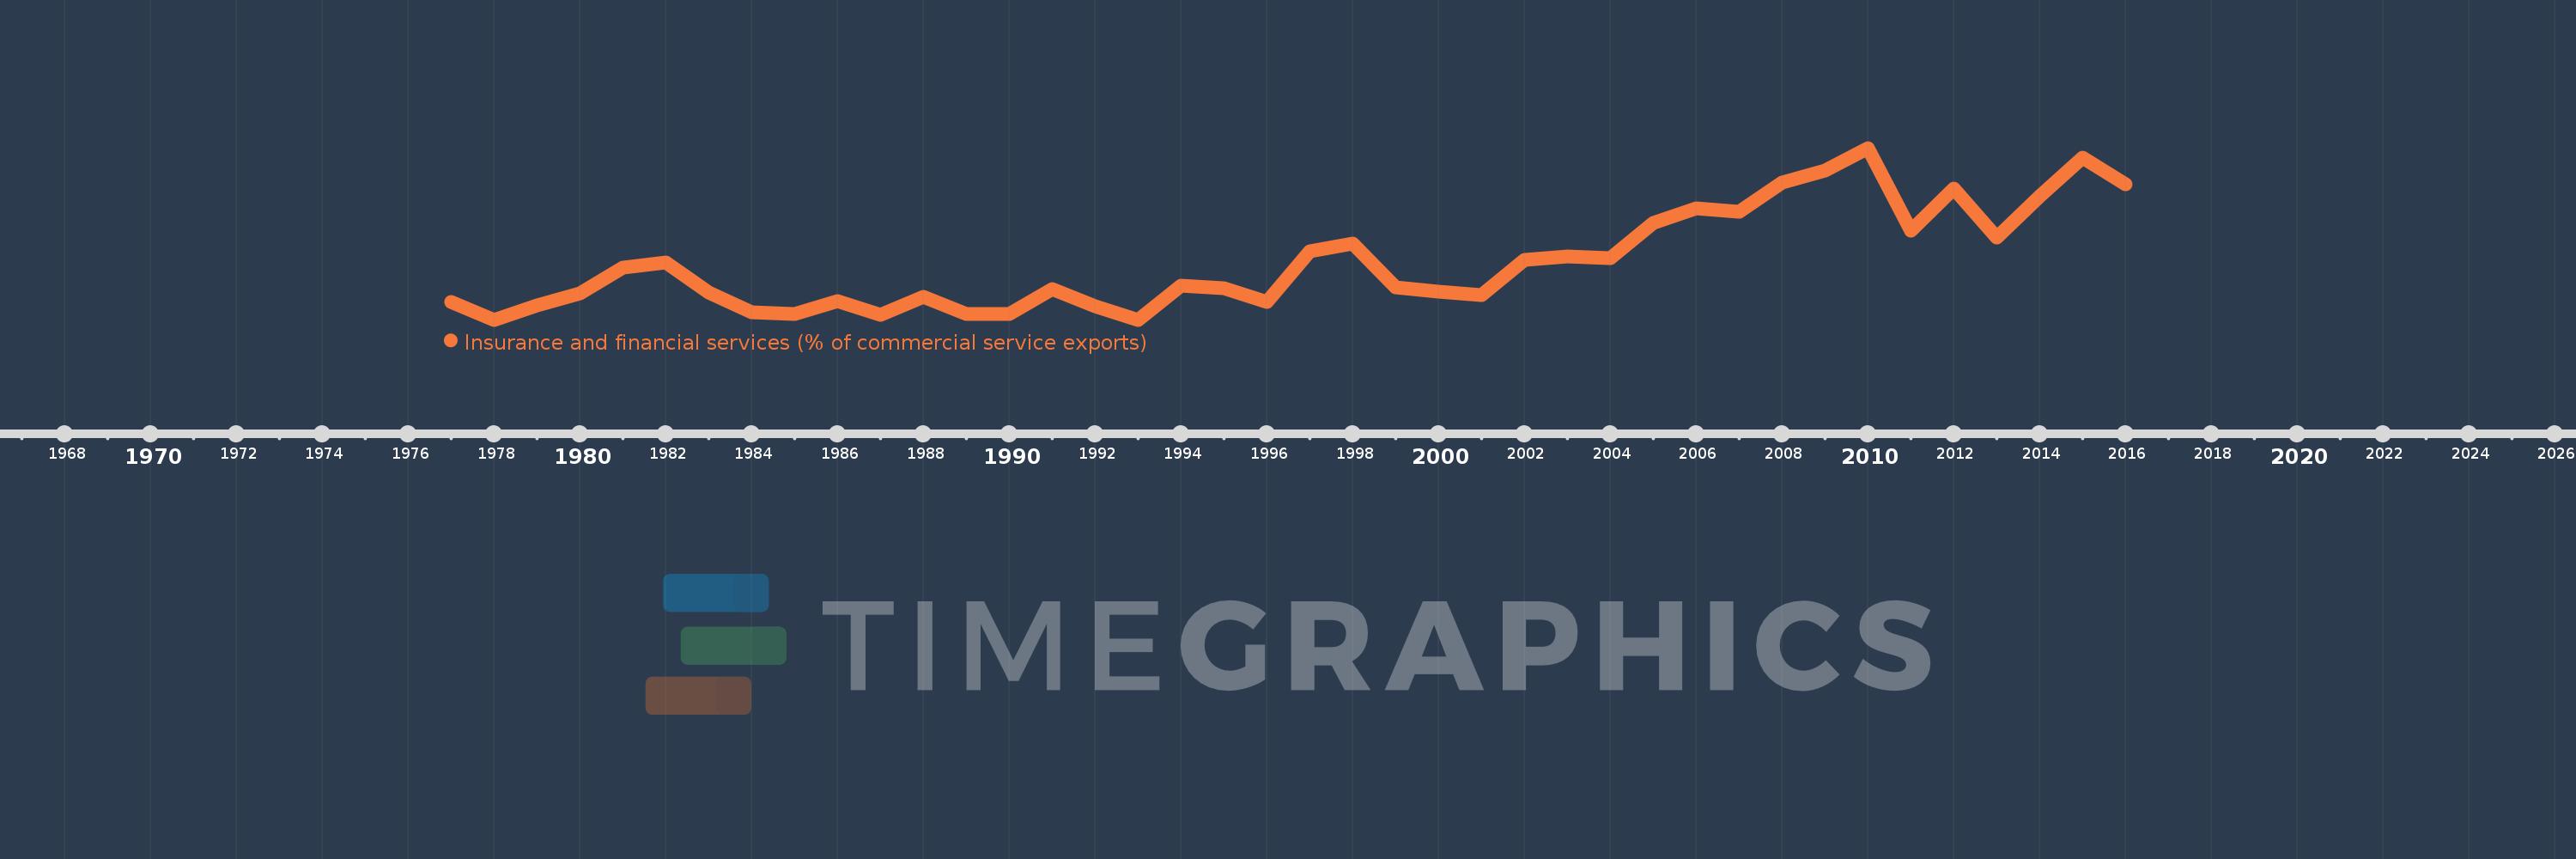
Insurance and financial services (% of commercial service exports)
2016,2015,2014,2013,2012,2011,2010,2009,2008,2007,2006,2005,2004,2003,2002,2001,2000,1999,1998,1997,1996,1995,1994,1993,1992,1991,1990,1989,1988,1987,1986,1985,1984,1983,1982,1981,1980,1979,1978,1977
Queste statistiche in altri paesi:
AfghanistanAlbaniaAlgeriaAngolaAntigua and BarbudaArab WorldArgentinaArmeniaArubaAustraliaAustriaAzerbaijanBahrainBangladeshBarbadosBelarusBelgiumBelizeBeninBermudaBhutanBoliviaBosnia and HerzegovinaBotswanaBrazilBrunei DarussalamBulgariaBurkina FasoBurundiCabo VerdeCambodiaCameroonCanadaCaribbean small statesCentral African RepublicCentral Europe and the BalticsChadChileChinaColombiaComorosCongo, Dem. Rep.Congo, Rep.Costa RicaCote d'IvoireCroatiaCuracaoCyprusCzech RepublicDenmarkDominicaDominican RepublicEarly-demographic dividendEast Asia & PacificEast Asia & Pacific (excluding high income)East Asia & Pacific (IDA & IBRD countries)EcuadorEgypt, Arab Rep.El SalvadorEritreaEstoniaEthiopiaEuro areaEurope & Central AsiaEurope & Central Asia (excluding high income)Europe & Central Asia (IDA & IBRD countries)European UnionFaroe IslandsFijiFinlandFragile and conflict affected situationsFranceFrench PolynesiaGabonGambia, TheGeorgiaGermanyGhanaGreeceGrenadaGuatemalaGuineaGuinea-BissauGuyanaHaitiHeavily indebted poor countries (HIPC)High incomeHondurasHong Kong SAR, ChinaHungaryIBRD onlyIcelandIDA & IBRD totalIDA onlyIDA totalIndiaIndonesiaIran, Islamic Rep.IraqIrelandIsraelItalyJamaicaJapanJordanKazakhstanKenyaKiribatiKorea, Rep.KosovoKuwaitKyrgyz RepublicLao PDRLate-demographic dividendLatin America & Caribbean Latin America & Caribbean (excluding high income)Latin America & the Caribbean (IDA & IBRD countries)LatviaLeast developed countries: UN classificationLebanonLesothoLiberiaLibyaLithuaniaLow & middle incomeLow incomeLower middle incomeLuxembourgMacao SAR, ChinaMacedonia, FYRMadagascarMalawiMalaysiaMaldivesMaliMaltaMauritaniaMauritiusMexicoMiddle East & North AfricaMiddle East & North Africa (excluding high income)Middle East & North Africa (IDA & IBRD countries)Middle incomeMoldovaMongoliaMontenegroMoroccoMozambiqueMyanmarNamibiaNepalNetherlandsNew CaledoniaNew ZealandNicaraguaNigerNigeriaNorth AmericaNorwayOECD membersOmanOther small statesPacific island small statesPakistanPalauPanamaPapua New GuineaParaguayPeruPhilippinesPolandPortugalPost-demographic dividendPre-demographic dividendQatarRomaniaRussian FederationRwandaSamoaSao Tome and PrincipeSaudi ArabiaSenegalSerbiaSeychellesSierra LeoneSingaporeSint Maarten (Dutch part)Slovak RepublicSloveniaSmall statesSolomon IslandsSouth AfricaSouth AsiaSouth Asia (IDA & IBRD)South SudanSpainSri LankaSt. Kitts and NevisSt. LuciaSt. Vincent and the GrenadinesSub-Saharan Africa Sub-Saharan Africa (excluding high income)Sub-Saharan Africa (IDA & IBRD countries)SudanSurinameSwazilandSwedenSwitzerlandSyrian Arab RepublicTajikistanTanzaniaThailandTimor-LesteTogoTongaTrinidad and TobagoTunisiaTurkeyTuvaluUgandaUkraineUnited KingdomUnited StatesUpper middle incomeUruguayVanuatuVenezuela, RBWest Bank and GazaWorldZambiaZimbabwe Linea del tempo:
Questa scala temporale mostra un grafico dal 1977 anno al 2016 anno. Pakistan. I dati fino ad 1976 anno non disponibili. Il numero di osservazioni attuali secondo i date: 40.
La fonte (nome):
Indicatori dello sviluppo mondiale
La fonte (organizzazione):
International Monetary Fund, Balance of Payments Statistics Yearbook and data files.
Categorie:
Private Sector, Trade
sono stati aggiornati
23 apr 2017 anni
Indicatori delle variazioni dei valori per anni
Minima:
0.424
1 gen 1993 anni
Massimo:
5.789
1 gen 2010 anni
Alla data di osservazione
Valore
Variazione assoluta
La variazione rispetto al valore precedente
1 gen 1977 anni
0.981
+0.981
0.0%
1 gen 1978 anni
0.426
-0.555
-56.58%
1 gen 1979 anni
0.864
+0.438
102.8%
1 gen 1980 anni
1.257
+0.393
45.48%
1 gen 1981 anni
2.046
+0.789
62.77%
1 gen 1982 anni
2.201
+0.155
7.56%
1 gen 1983 anni
1.272
-0.929
-42.22%
1 gen 1984 anni
0.664
-0.607
-47.74%
1 gen 1985 anni
0.596
-0.069
-10.32%
1 gen 1986 anni
1.009
+0.413
69.29%
1 gen 1987 anni
0.574
-0.435
-43.14%
1 gen 1988 anni
1.146
+0.572
99.75%
1 gen 1989 anni
0.602
-0.544
-47.48%
1 gen 1990 anni
0.608
+0.006
1.03%
1 gen 1991 anni
1.384
+0.776
127.67%
1 gen 1992 anni
0.843
-0.541
-39.08%
1 gen 1993 anni
0.424
-0.419
-49.74%
1 gen 1994 anni
1.494
+1.07
252.59%
1 gen 1995 anni
1.42
-0.074
-4.96%
1 gen 1996 anni
0.987
-0.433
-30.46%
1 gen 1997 anni
2.554
+1.567
158.66%
1 gen 1998 anni
2.801
+0.247
9.66%
1 gen 1999 anni
1.431
-1.37
-48.91%
1 gen 2000 anni
1.31
-0.12
-8.42%
1 gen 2001 anni
1.206
-0.105
-7.98%
1 gen 2002 anni
2.3
+1.094
90.73%
1 gen 2003 anni
2.41
+0.111
4.81%
1 gen 2004 anni
2.35
-0.061
-2.52%
1 gen 2005 anni
3.438
+1.089
46.33%
1 gen 2006 anni
3.894
+0.455
13.24%
1 gen 2007 anni
3.794
-0.1
-2.56%
1 gen 2008 anni
4.714
+0.92
24.25%
1 gen 2009 anni
5.085
+0.371
7.88%
1 gen 2010 anni
5.789
+0.704
13.84%
1 gen 2011 anni
3.207
-2.582
-44.6%
1 gen 2012 anni
4.513
+1.305
40.71%
1 gen 2013 anni
2.995
-1.517
-33.62%
1 gen 2014 anni
4.291
+1.296
43.27%
1 gen 2015 anni
5.481
+1.189
27.71%
1 gen 2016 anni
4.665
-0.816
-14.88%
Classificazione dei paesi secondo i statistiche attuali per anni


Commenti: