29
/it/
it
AIzaSyAYiBZKx7MnpbEhh9jyipgxe19OcubqV5w
April 1, 2024
61215
Sub-Saharan Africa (IDA & IBRD countries)
TSS
false
2
1
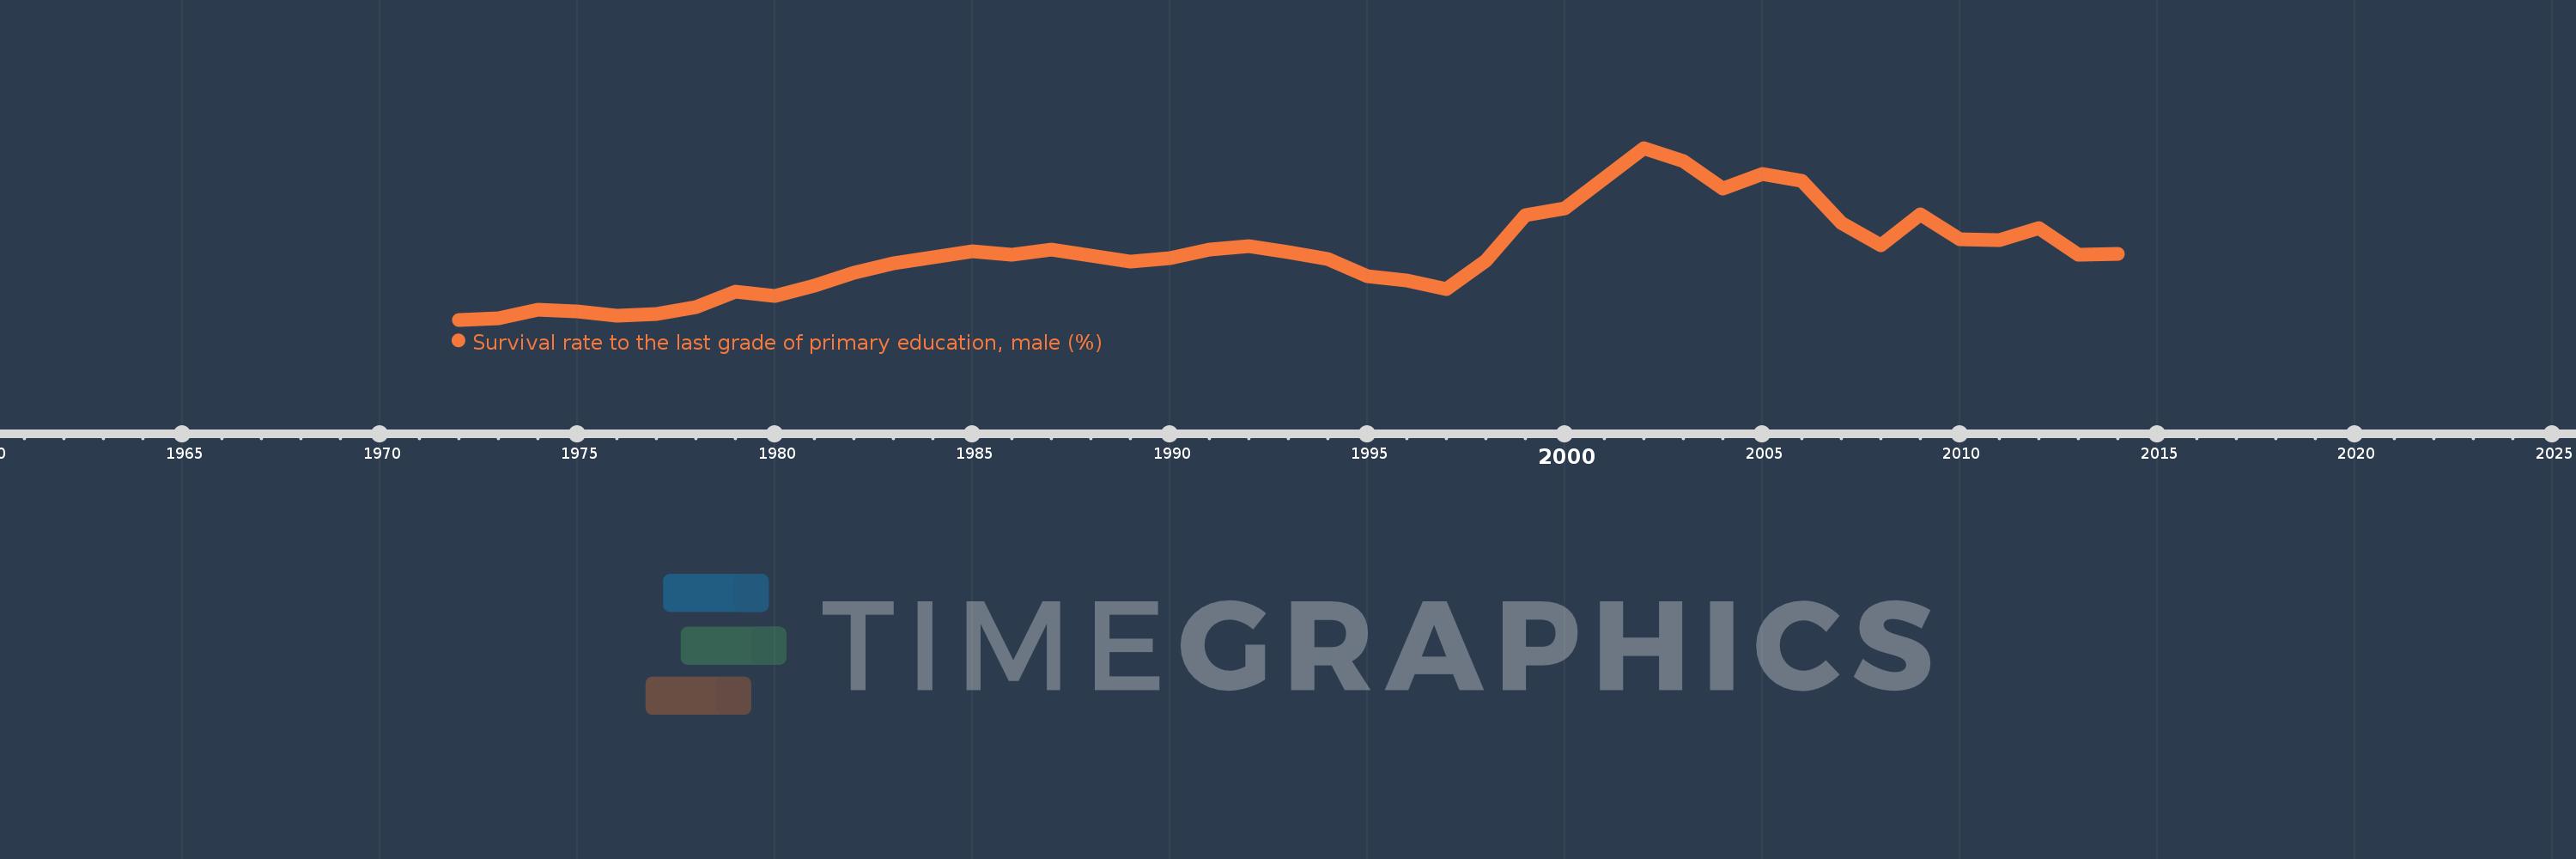
Survival rate to the last grade of primary education, male (%)
2014,2013,2012,2011,2010,2009,2008,2007,2006,2005,2004,2003,2002,2001,2000,1999,1998,1997,1996,1995,1994,1993,1992,1991,1990,1989,1988,1987,1986,1985,1984,1983,1982,1981,1980,1979,1978,1977,1976,1975,1974,1973,1972
Queste statistiche in altri paesi:
AfghanistanAlbaniaAlgeriaAndorraAngolaArab WorldArgentinaArmeniaArubaAustriaAzerbaijanBahamas, TheBahrainBangladeshBarbadosBelarusBelgiumBelizeBeninBermudaBhutanBoliviaBosnia and HerzegovinaBotswanaBrazilBrunei DarussalamBulgariaBurkina FasoBurundiCabo VerdeCambodiaCameroonCanadaCaribbean small statesCentral African RepublicCentral Europe and the BalticsChadChileChinaColombiaComorosCongo, Dem. Rep.Congo, Rep.Costa RicaCote d'IvoireCroatiaCubaCyprusCzech RepublicDenmarkDjiboutiDominicaDominican RepublicEarly-demographic dividendEast Asia & PacificEast Asia & Pacific (excluding high income)East Asia & Pacific (IDA & IBRD countries)EcuadorEgypt, Arab Rep.El SalvadorEquatorial GuineaEritreaEstoniaEthiopiaEuro areaEurope & Central AsiaEurope & Central Asia (excluding high income)Europe & Central Asia (IDA & IBRD countries)European UnionFijiFinlandFragile and conflict affected situationsFranceGabonGambia, TheGeorgiaGermanyGhanaGreeceGuatemalaGuineaGuinea-BissauGuyanaHaitiHeavily indebted poor countries (HIPC)High incomeHondurasHong Kong SAR, ChinaHungaryIBRD onlyIcelandIDA & IBRD totalIDA blendIDA onlyIDA totalIndiaIndonesiaIran, Islamic Rep.IraqIsraelItalyJamaicaJapanJordanKazakhstanKenyaKiribatiKorea, Rep.KuwaitKyrgyz RepublicLao PDRLate-demographic dividendLatin America & Caribbean Latin America & Caribbean (excluding high income)Latin America & the Caribbean (IDA & IBRD countries)LatviaLeast developed countries: UN classificationLebanonLesothoLiberiaLibyaLiechtensteinLithuaniaLow & middle incomeLow incomeLower middle incomeLuxembourgMacao SAR, ChinaMacedonia, FYRMadagascarMalawiMalaysiaMaldivesMaliMaltaMarshall IslandsMauritaniaMauritiusMexicoMiddle East & North AfricaMiddle East & North Africa (excluding high income)Middle East & North Africa (IDA & IBRD countries)Middle incomeMoldovaMongoliaMontenegroMoroccoMozambiqueMyanmarNamibiaNepalNetherlandsNicaraguaNigerNigeriaNorth AmericaNorwayOECD membersOmanOther small statesPacific island small statesPakistanPanamaPapua New GuineaParaguayPeruPhilippinesPolandPortugalPost-demographic dividendPre-demographic dividendQatarRomaniaRussian FederationRwandaSamoaSan MarinoSao Tome and PrincipeSaudi ArabiaSenegalSerbiaSeychellesSierra LeoneSingaporeSlovak RepublicSloveniaSmall statesSolomon IslandsSouth AfricaSouth AsiaSouth Asia (IDA & IBRD)SpainSri LankaSt. Kitts and NevisSt. LuciaSt. Vincent and the GrenadinesSub-Saharan Africa Sub-Saharan Africa (excluding high income)Sub-Saharan Africa (IDA & IBRD countries)SudanSurinameSwazilandSwedenSwitzerlandSyrian Arab RepublicTajikistanTanzaniaThailandTimor-LesteTogoTongaTrinidad and TobagoTunisiaTurkeyUgandaUkraineUnited Arab EmiratesUpper middle incomeUruguayUzbekistanVanuatuVenezuela, RBVietnamWest Bank and GazaWorldYemen, Rep.ZambiaZimbabwe Linea del tempo:
Questa scala temporale mostra un grafico dal 1972 anno al 2014 anno. Sub-Saharan Africa (IDA & IBRD countries). I dati fino ad 1971 anno non disponibili. Il numero di osservazioni attuali secondo i date: 43.
La fonte (nome):
Indicatori dello sviluppo mondiale
La fonte (organizzazione):
UNESCO Institute for Statistics
Categorie:
Education, Gender
sono stati aggiornati
23 apr 2017 anni
Indicatori delle variazioni dei valori per anni
Minima:
50.761
1 gen 1972 anni
Massimo:
64.916
1 gen 2002 anni
Alla data di osservazione
Valore
Variazione assoluta
La variazione rispetto al valore precedente
1 gen 1972 anni
50.761
+50.761
0.0%
1 gen 1973 anni
50.905
+0.144
0.28%
1 gen 1974 anni
51.598
+0.693
1.36%
1 gen 1975 anni
51.427
-0.171
-0.33%
1 gen 1976 anni
51.065
-0.362
-0.7%
1 gen 1977 anni
51.259
+0.194
0.38%
1 gen 1978 anni
51.825
+0.567
1.11%
1 gen 1979 anni
53.103
+1.278
2.47%
1 gen 1980 anni
52.717
-0.387
-0.73%
1 gen 1981 anni
53.541
+0.824
1.56%
1 gen 1982 anni
54.639
+1.099
2.05%
1 gen 1983 anni
55.44
+0.801
1.47%
1 gen 1984 anni
55.877
+0.437
0.79%
1 gen 1985 anni
56.429
+0.553
0.99%
1 gen 1986 anni
56.124
-0.305
-0.54%
1 gen 1987 anni
56.532
+0.407
0.73%
1 gen 1988 anni
56.064
-0.468
-0.83%
1 gen 1989 anni
55.536
-0.527
-0.94%
1 gen 1990 anni
55.851
+0.314
0.57%
1 gen 1991 anni
56.543
+0.692
1.24%
1 gen 1992 anni
56.839
+0.296
0.52%
1 gen 1993 anni
56.346
-0.493
-0.87%
1 gen 1994 anni
55.768
-0.579
-1.03%
1 gen 1995 anni
54.367
-1.401
-2.51%
1 gen 1996 anni
54.016
-0.351
-0.65%
1 gen 1997 anni
53.289
-0.727
-1.35%
1 gen 1998 anni
55.622
+2.334
4.38%
1 gen 1999 anni
59.341
+3.719
6.69%
1 gen 2000 anni
59.967
+0.626
1.06%
1 gen 2001 anni
62.391
+2.424
4.04%
1 gen 2002 anni
64.916
+2.525
4.05%
1 gen 2003 anni
63.868
-1.048
-1.61%
1 gen 2004 anni
61.576
-2.291
-3.59%
1 gen 2005 anni
62.765
+1.189
1.93%
1 gen 2006 anni
62.211
-0.554
-0.88%
1 gen 2007 anni
58.736
-3.475
-5.59%
1 gen 2008 anni
56.903
-1.833
-3.12%
1 gen 2009 anni
59.42
+2.517
4.42%
1 gen 2010 anni
57.428
-1.992
-3.35%
1 gen 2011 anni
57.307
-0.12
-0.21%
1 gen 2012 anni
58.316
+1.009
1.76%
1 gen 2013 anni
56.154
-2.162
-3.71%
1 gen 2014 anni
56.193
+0.039
0.07%
Classificazione dei paesi secondo i statistiche attuali per anni


Commenti: