29
/it/
it
AIzaSyAYiBZKx7MnpbEhh9jyipgxe19OcubqV5w
April 1, 2024
37817
IDA & IBRD total
IBT
false
2
1
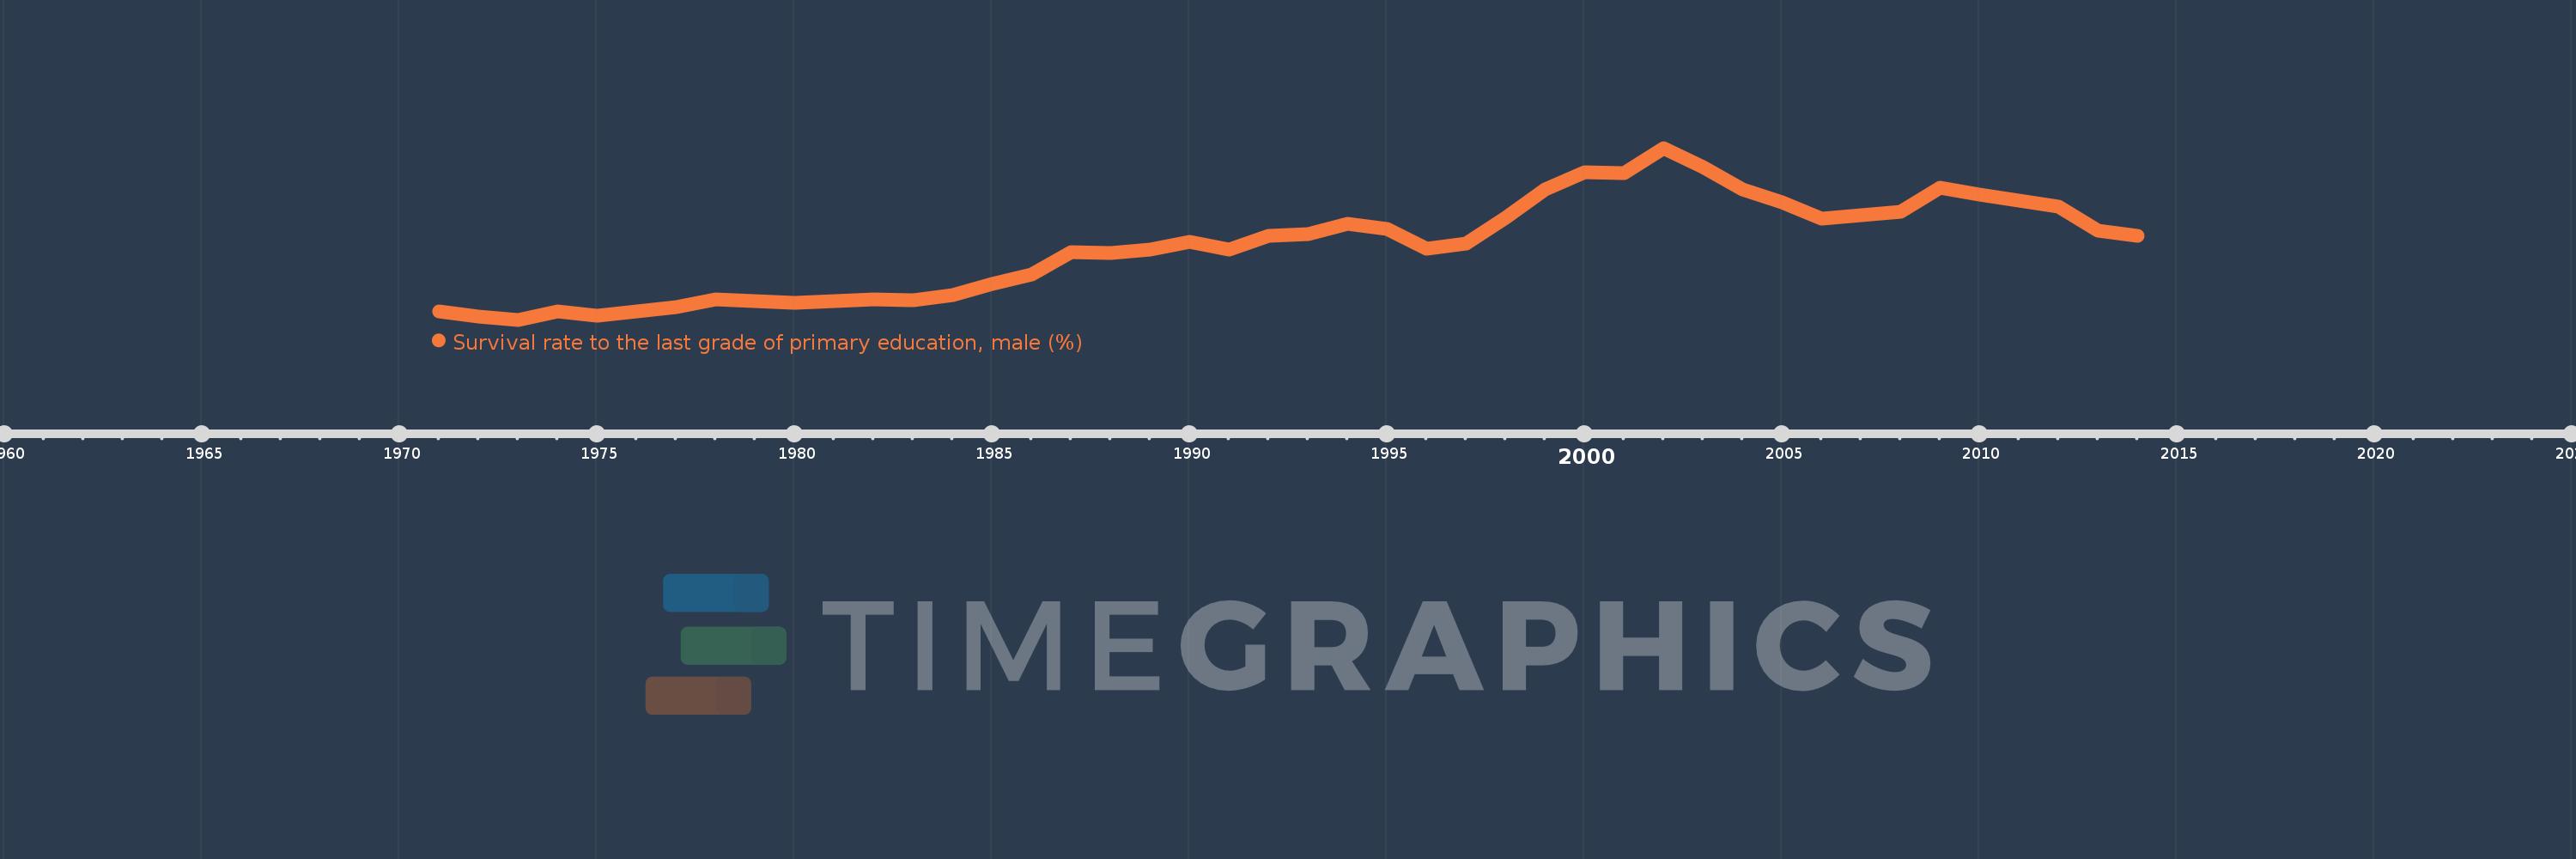
Survival rate to the last grade of primary education, male (%)
2014,2013,2012,2011,2010,2009,2008,2007,2006,2005,2004,2003,2002,2001,2000,1999,1998,1997,1996,1995,1994,1993,1992,1991,1990,1989,1988,1987,1986,1985,1984,1983,1982,1981,1980,1979,1978,1977,1976,1975,1974,1973,1972,1971
Queste statistiche in altri paesi:
AfghanistanAlbaniaAlgeriaAndorraAngolaArab WorldArgentinaArmeniaArubaAustriaAzerbaijanBahamas, TheBahrainBangladeshBarbadosBelarusBelgiumBelizeBeninBermudaBhutanBoliviaBosnia and HerzegovinaBotswanaBrazilBrunei DarussalamBulgariaBurkina FasoBurundiCabo VerdeCambodiaCameroonCanadaCaribbean small statesCentral African RepublicCentral Europe and the BalticsChadChileChinaColombiaComorosCongo, Dem. Rep.Congo, Rep.Costa RicaCote d'IvoireCroatiaCubaCyprusCzech RepublicDenmarkDjiboutiDominicaDominican RepublicEarly-demographic dividendEast Asia & PacificEast Asia & Pacific (excluding high income)East Asia & Pacific (IDA & IBRD countries)EcuadorEgypt, Arab Rep.El SalvadorEquatorial GuineaEritreaEstoniaEthiopiaEuro areaEurope & Central AsiaEurope & Central Asia (excluding high income)Europe & Central Asia (IDA & IBRD countries)European UnionFijiFinlandFragile and conflict affected situationsFranceGabonGambia, TheGeorgiaGermanyGhanaGreeceGuatemalaGuineaGuinea-BissauGuyanaHaitiHeavily indebted poor countries (HIPC)High incomeHondurasHong Kong SAR, ChinaHungaryIBRD onlyIcelandIDA & IBRD totalIDA blendIDA onlyIDA totalIndiaIndonesiaIran, Islamic Rep.IraqIsraelItalyJamaicaJapanJordanKazakhstanKenyaKiribatiKorea, Rep.KuwaitKyrgyz RepublicLao PDRLate-demographic dividendLatin America & Caribbean Latin America & Caribbean (excluding high income)Latin America & the Caribbean (IDA & IBRD countries)LatviaLeast developed countries: UN classificationLebanonLesothoLiberiaLibyaLiechtensteinLithuaniaLow & middle incomeLow incomeLower middle incomeLuxembourgMacao SAR, ChinaMacedonia, FYRMadagascarMalawiMalaysiaMaldivesMaliMaltaMarshall IslandsMauritaniaMauritiusMexicoMiddle East & North AfricaMiddle East & North Africa (excluding high income)Middle East & North Africa (IDA & IBRD countries)Middle incomeMoldovaMongoliaMontenegroMoroccoMozambiqueMyanmarNamibiaNepalNetherlandsNicaraguaNigerNigeriaNorth AmericaNorwayOECD membersOmanOther small statesPacific island small statesPakistanPanamaPapua New GuineaParaguayPeruPhilippinesPolandPortugalPost-demographic dividendPre-demographic dividendQatarRomaniaRussian FederationRwandaSamoaSan MarinoSao Tome and PrincipeSaudi ArabiaSenegalSerbiaSeychellesSierra LeoneSingaporeSlovak RepublicSloveniaSmall statesSolomon IslandsSouth AfricaSouth AsiaSouth Asia (IDA & IBRD)SpainSri LankaSt. Kitts and NevisSt. LuciaSt. Vincent and the GrenadinesSub-Saharan Africa Sub-Saharan Africa (excluding high income)Sub-Saharan Africa (IDA & IBRD countries)SudanSurinameSwazilandSwedenSwitzerlandSyrian Arab RepublicTajikistanTanzaniaThailandTimor-LesteTogoTongaTrinidad and TobagoTunisiaTurkeyUgandaUkraineUnited Arab EmiratesUpper middle incomeUruguayUzbekistanVanuatuVenezuela, RBVietnamWest Bank and GazaWorldYemen, Rep.ZambiaZimbabwe Linea del tempo:
Questa scala temporale mostra un grafico dal 1971 anno al 2014 anno. IDA & IBRD total. I dati fino ad 1970 anno non disponibili. Il numero di osservazioni attuali secondo i date: 44.
La fonte (nome):
Indicatori dello sviluppo mondiale
La fonte (organizzazione):
UNESCO Institute for Statistics
Categorie:
Education, Gender
sono stati aggiornati
23 apr 2017 anni
Indicatori delle variazioni dei valori per anni
Minima:
63.53
1 gen 1973 anni
Massimo:
74.765
1 gen 2002 anni
Alla data di osservazione
Valore
Variazione assoluta
La variazione rispetto al valore precedente
1 gen 1971 anni
64.097
+64.097
0.0%
1 gen 1972 anni
63.736
-0.36
-0.56%
1 gen 1973 anni
63.53
-0.207
-0.32%
1 gen 1974 anni
64.058
+0.528
0.83%
1 gen 1975 anni
63.806
-0.252
-0.39%
1 gen 1976 anni
64.057
+0.251
0.39%
1 gen 1977 anni
64.383
+0.326
0.51%
1 gen 1978 anni
64.863
+0.48
0.75%
1 gen 1979 anni
64.742
-0.121
-0.19%
1 gen 1980 anni
64.627
-0.115
-0.18%
1 gen 1981 anni
64.733
+0.107
0.16%
1 gen 1982 anni
64.888
+0.155
0.24%
1 gen 1983 anni
64.833
-0.055
-0.09%
1 gen 1984 anni
65.125
+0.292
0.45%
1 gen 1985 anni
65.861
+0.736
1.13%
1 gen 1986 anni
66.512
+0.651
0.99%
1 gen 1987 anni
67.957
+1.445
2.17%
1 gen 1988 anni
67.892
-0.066
-0.1%
1 gen 1989 anni
68.143
+0.251
0.37%
1 gen 1990 anni
68.647
+0.504
0.74%
1 gen 1991 anni
68.135
-0.512
-0.75%
1 gen 1992 anni
69.014
+0.88
1.29%
1 gen 1993 anni
69.118
+0.104
0.15%
1 gen 1994 anni
69.795
+0.677
0.98%
1 gen 1995 anni
69.484
-0.31
-0.44%
1 gen 1996 anni
68.197
-1.287
-1.85%
1 gen 1997 anni
68.511
+0.314
0.46%
1 gen 1998 anni
70.201
+1.69
2.47%
1 gen 1999 anni
72.042
+1.841
2.62%
1 gen 2000 anni
73.179
+1.137
1.58%
1 gen 2001 anni
73.121
-0.058
-0.08%
1 gen 2002 anni
74.765
+1.644
2.25%
1 gen 2003 anni
73.487
-1.279
-1.71%
1 gen 2004 anni
72.062
-1.425
-1.94%
1 gen 2005 anni
71.234
-0.828
-1.15%
1 gen 2006 anni
70.159
-1.075
-1.51%
1 gen 2007 anni
70.361
+0.202
0.29%
1 gen 2008 anni
70.573
+0.212
0.3%
1 gen 2009 anni
72.185
+1.612
2.28%
1 gen 2010 anni
71.706
-0.479
-0.66%
1 gen 2011 anni
71.322
-0.383
-0.53%
1 gen 2012 anni
70.947
-0.375
-0.53%
1 gen 2013 anni
69.377
-1.57
-2.21%
1 gen 2014 anni
69.045
-0.332
-0.48%
Classificazione dei paesi secondo i statistiche attuali per anni


Commenti: