29
/it/
it
AIzaSyAYiBZKx7MnpbEhh9jyipgxe19OcubqV5w
April 1, 2024
37029
IBRD only
IBD
false
2
1
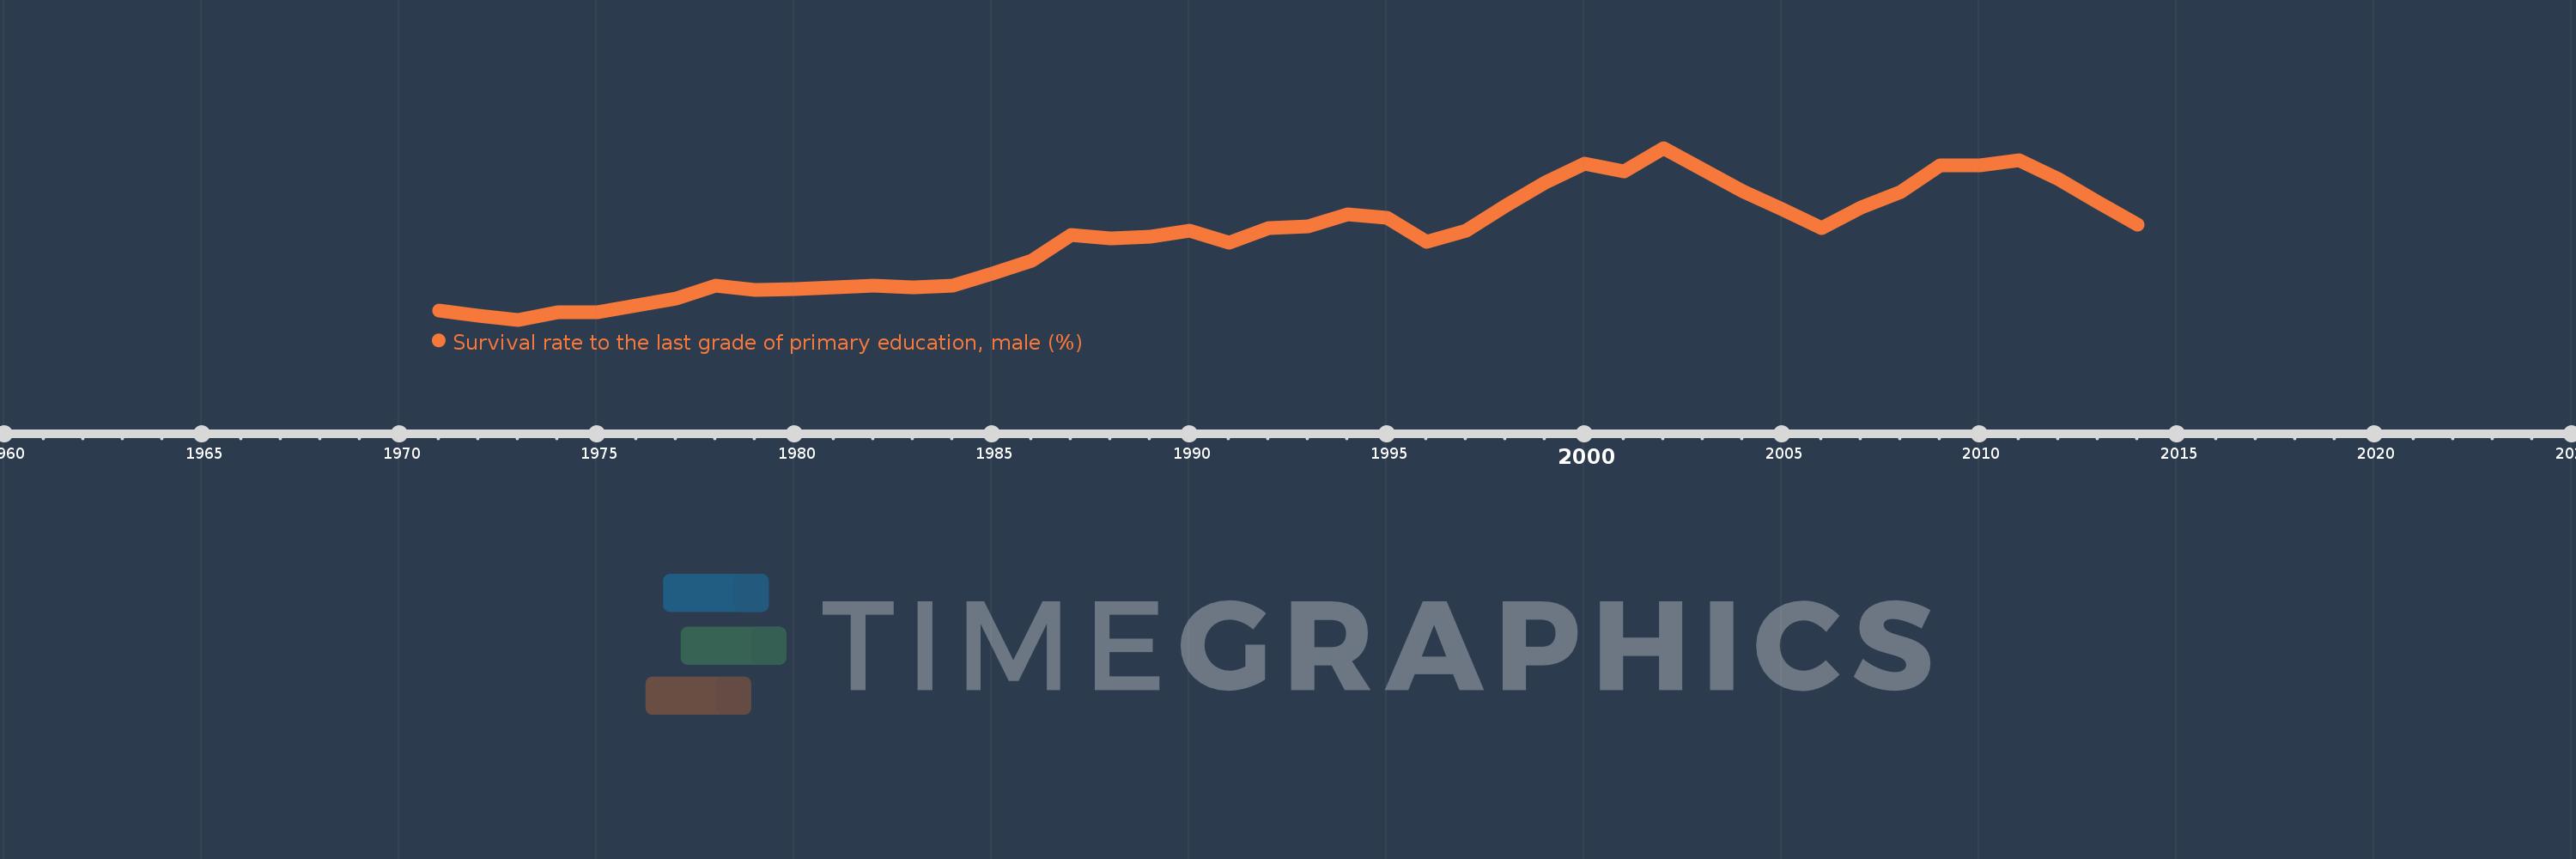
Survival rate to the last grade of primary education, male (%)
2014,2013,2012,2011,2010,2009,2008,2007,2006,2005,2004,2003,2002,2001,2000,1999,1998,1997,1996,1995,1994,1993,1992,1991,1990,1989,1988,1987,1986,1985,1984,1983,1982,1981,1980,1979,1978,1977,1976,1975,1974,1973,1972,1971
Queste statistiche in altri paesi:
AfghanistanAlbaniaAlgeriaAndorraAngolaArab WorldArgentinaArmeniaArubaAustriaAzerbaijanBahamas, TheBahrainBangladeshBarbadosBelarusBelgiumBelizeBeninBermudaBhutanBoliviaBosnia and HerzegovinaBotswanaBrazilBrunei DarussalamBulgariaBurkina FasoBurundiCabo VerdeCambodiaCameroonCanadaCaribbean small statesCentral African RepublicCentral Europe and the BalticsChadChileChinaColombiaComorosCongo, Dem. Rep.Congo, Rep.Costa RicaCote d'IvoireCroatiaCubaCyprusCzech RepublicDenmarkDjiboutiDominicaDominican RepublicEarly-demographic dividendEast Asia & PacificEast Asia & Pacific (excluding high income)East Asia & Pacific (IDA & IBRD countries)EcuadorEgypt, Arab Rep.El SalvadorEquatorial GuineaEritreaEstoniaEthiopiaEuro areaEurope & Central AsiaEurope & Central Asia (excluding high income)Europe & Central Asia (IDA & IBRD countries)European UnionFijiFinlandFragile and conflict affected situationsFranceGabonGambia, TheGeorgiaGermanyGhanaGreeceGuatemalaGuineaGuinea-BissauGuyanaHaitiHeavily indebted poor countries (HIPC)High incomeHondurasHong Kong SAR, ChinaHungaryIBRD onlyIcelandIDA & IBRD totalIDA blendIDA onlyIDA totalIndiaIndonesiaIran, Islamic Rep.IraqIsraelItalyJamaicaJapanJordanKazakhstanKenyaKiribatiKorea, Rep.KuwaitKyrgyz RepublicLao PDRLate-demographic dividendLatin America & Caribbean Latin America & Caribbean (excluding high income)Latin America & the Caribbean (IDA & IBRD countries)LatviaLeast developed countries: UN classificationLebanonLesothoLiberiaLibyaLiechtensteinLithuaniaLow & middle incomeLow incomeLower middle incomeLuxembourgMacao SAR, ChinaMacedonia, FYRMadagascarMalawiMalaysiaMaldivesMaliMaltaMarshall IslandsMauritaniaMauritiusMexicoMiddle East & North AfricaMiddle East & North Africa (excluding high income)Middle East & North Africa (IDA & IBRD countries)Middle incomeMoldovaMongoliaMontenegroMoroccoMozambiqueMyanmarNamibiaNepalNetherlandsNicaraguaNigerNigeriaNorth AmericaNorwayOECD membersOmanOther small statesPacific island small statesPakistanPanamaPapua New GuineaParaguayPeruPhilippinesPolandPortugalPost-demographic dividendPre-demographic dividendQatarRomaniaRussian FederationRwandaSamoaSan MarinoSao Tome and PrincipeSaudi ArabiaSenegalSerbiaSeychellesSierra LeoneSingaporeSlovak RepublicSloveniaSmall statesSolomon IslandsSouth AfricaSouth AsiaSouth Asia (IDA & IBRD)SpainSri LankaSt. Kitts and NevisSt. LuciaSt. Vincent and the GrenadinesSub-Saharan Africa Sub-Saharan Africa (excluding high income)Sub-Saharan Africa (IDA & IBRD countries)SudanSurinameSwazilandSwedenSwitzerlandSyrian Arab RepublicTajikistanTanzaniaThailandTimor-LesteTogoTongaTrinidad and TobagoTunisiaTurkeyUgandaUkraineUnited Arab EmiratesUpper middle incomeUruguayUzbekistanVanuatuVenezuela, RBVietnamWest Bank and GazaWorldYemen, Rep.ZambiaZimbabwe Linea del tempo:
Questa scala temporale mostra un grafico dal 1971 anno al 2014 anno. IBRD only. I dati fino ad 1970 anno non disponibili. Il numero di osservazioni attuali secondo i date: 44.
La fonte (nome):
Indicatori dello sviluppo mondiale
La fonte (organizzazione):
UNESCO Institute for Statistics
Categorie:
Education, Gender
sono stati aggiornati
23 apr 2017 anni
Indicatori delle variazioni dei valori per anni
Minima:
65.877
1 gen 1973 anni
Massimo:
78.056
1 gen 2002 anni
Alla data di osservazione
Valore
Variazione assoluta
La variazione rispetto al valore precedente
1 gen 1971 anni
66.51
+66.51
0.0%
1 gen 1972 anni
66.141
-0.369
-0.56%
1 gen 1973 anni
65.877
-0.264
-0.4%
1 gen 1974 anni
66.383
+0.507
0.77%
1 gen 1975 anni
66.393
+0.01
0.02%
1 gen 1976 anni
66.903
+0.51
0.77%
1 gen 1977 anni
67.374
+0.471
0.7%
1 gen 1978 anni
68.312
+0.938
1.39%
1 gen 1979 anni
68.019
-0.294
-0.43%
1 gen 1980 anni
68.069
+0.051
0.07%
1 gen 1981 anni
68.166
+0.096
0.14%
1 gen 1982 anni
68.27
+0.104
0.15%
1 gen 1983 anni
68.186
-0.084
-0.12%
1 gen 1984 anni
68.303
+0.117
0.17%
1 gen 1985 anni
69.144
+0.841
1.23%
1 gen 1986 anni
70.031
+0.886
1.28%
1 gen 1987 anni
71.862
+1.831
2.61%
1 gen 1988 anni
71.633
-0.229
-0.32%
1 gen 1989 anni
71.766
+0.133
0.19%
1 gen 1990 anni
72.186
+0.421
0.59%
1 gen 1991 anni
71.354
-0.832
-1.15%
1 gen 1992 anni
72.346
+0.991
1.39%
1 gen 1993 anni
72.507
+0.162
0.22%
1 gen 1994 anni
73.367
+0.86
1.19%
1 gen 1995 anni
73.129
-0.238
-0.32%
1 gen 1996 anni
71.426
-1.703
-2.33%
1 gen 1997 anni
72.164
+0.738
1.03%
1 gen 1998 anni
73.962
+1.798
2.49%
1 gen 1999 anni
75.626
+1.664
2.25%
1 gen 2000 anni
76.932
+1.305
1.73%
1 gen 2001 anni
76.403
-0.529
-0.69%
1 gen 2002 anni
78.056
+1.653
2.16%
1 gen 2003 anni
76.495
-1.561
-2.0%
1 gen 2004 anni
74.975
-1.52
-1.99%
1 gen 2005 anni
73.738
-1.237
-1.65%
1 gen 2006 anni
72.379
-1.359
-1.84%
1 gen 2007 anni
73.831
+1.452
2.01%
1 gen 2008 anni
74.919
+1.088
1.47%
1 gen 2009 anni
76.797
+1.877
2.51%
1 gen 2010 anni
76.824
+0.028
0.04%
1 gen 2011 anni
77.205
+0.381
0.5%
1 gen 2012 anni
75.836
-1.369
-1.77%
1 gen 2013 anni
74.175
-1.661
-2.19%
1 gen 2014 anni
72.619
-1.556
-2.1%
Classificazione dei paesi secondo i statistiche attuali per anni


Commenti: