29
/it/
it
AIzaSyAYiBZKx7MnpbEhh9jyipgxe19OcubqV5w
April 1, 2024
60983
Sub-Saharan Africa (IDA & IBRD countries)
TSS
false
2
1
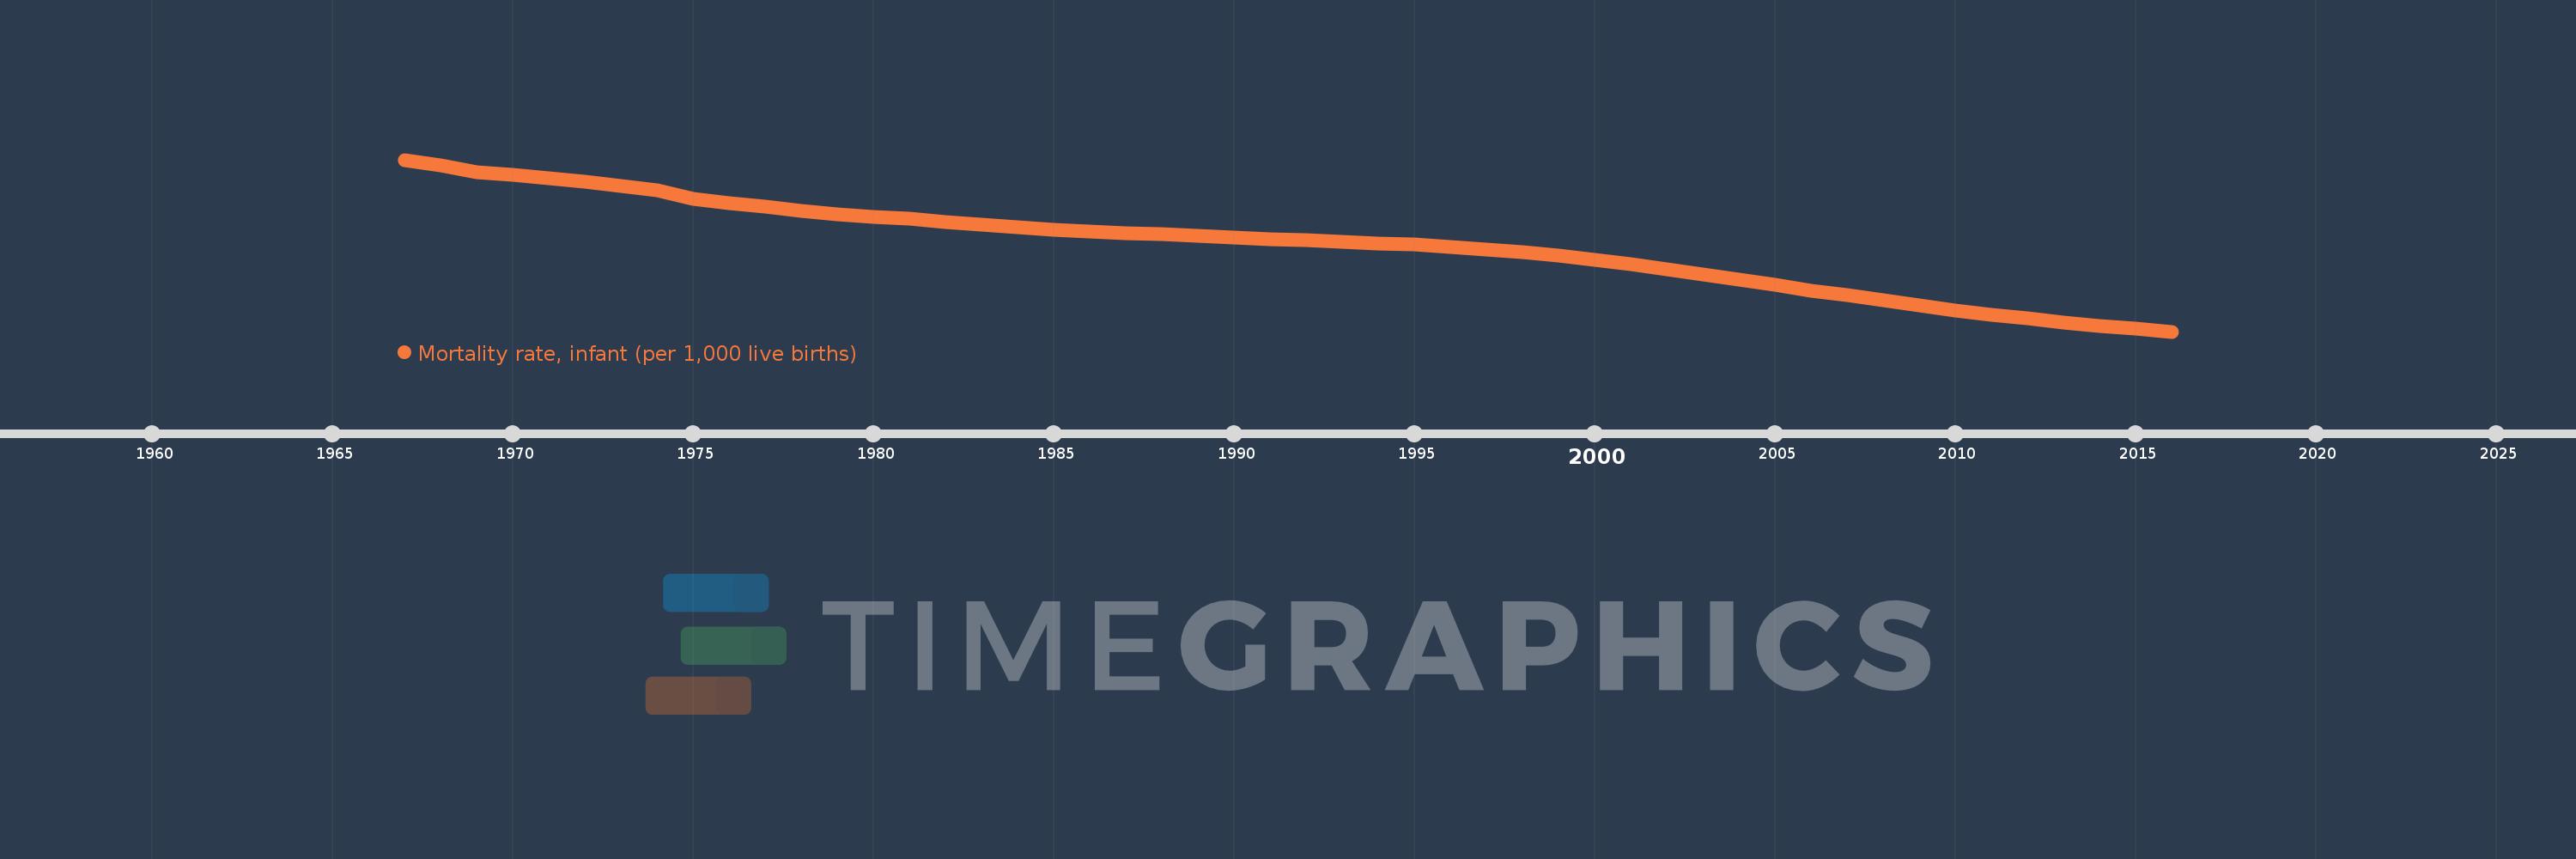
Mortality rate, infant (per 1,000 live births)
2016,2015,2014,2013,2012,2011,2010,2009,2008,2007,2006,2005,2004,2003,2002,2001,2000,1999,1998,1997,1996,1995,1994,1993,1992,1991,1990,1989,1988,1987,1986,1985,1984,1983,1982,1981,1980,1979,1978,1977,1976,1975,1974,1973,1972,1971,1970,1969,1968,1967
Queste statistiche in altri paesi:
AfghanistanAlbaniaAlgeriaAndorraAngolaAntigua and BarbudaArab WorldArgentinaArmeniaAustraliaAustriaAzerbaijanBahamas, TheBahrainBangladeshBarbadosBelarusBelgiumBelizeBeninBhutanBoliviaBosnia and HerzegovinaBotswanaBrazilBrunei DarussalamBulgariaBurkina FasoBurundiCabo VerdeCambodiaCameroonCanadaCaribbean small statesCentral African RepublicCentral Europe and the BalticsChadChileChinaColombiaComorosCongo, Dem. Rep.Congo, Rep.Costa RicaCote d'IvoireCroatiaCubaCyprusCzech RepublicDenmarkDjiboutiDominicaDominican RepublicEarly-demographic dividendEast Asia & PacificEast Asia & Pacific (excluding high income)East Asia & Pacific (IDA & IBRD countries)EcuadorEgypt, Arab Rep.El SalvadorEquatorial GuineaEritreaEstoniaEthiopiaEuro areaEurope & Central AsiaEurope & Central Asia (excluding high income)Europe & Central Asia (IDA & IBRD countries)European UnionFijiFinlandFragile and conflict affected situationsFranceGabonGambia, TheGeorgiaGermanyGhanaGreeceGrenadaGuatemalaGuineaGuinea-BissauGuyanaHaitiHeavily indebted poor countries (HIPC)High incomeHondurasHungaryIBRD onlyIcelandIDA & IBRD totalIDA blendIDA onlyIDA totalIndiaIndonesiaIran, Islamic Rep.IraqIrelandIsraelItalyJamaicaJapanJordanKazakhstanKenyaKiribatiKorea, Dem. People’s Rep.Korea, Rep.KuwaitKyrgyz RepublicLao PDRLate-demographic dividendLatin America & Caribbean Latin America & Caribbean (excluding high income)Latin America & the Caribbean (IDA & IBRD countries)LatviaLeast developed countries: UN classificationLebanonLesothoLiberiaLibyaLithuaniaLow & middle incomeLow incomeLower middle incomeLuxembourgMacedonia, FYRMadagascarMalawiMalaysiaMaldivesMaliMaltaMarshall IslandsMauritaniaMauritiusMexicoMicronesia, Fed. Sts.Middle East & North AfricaMiddle East & North Africa (excluding high income)Middle East & North Africa (IDA & IBRD countries)Middle incomeMoldovaMonacoMongoliaMontenegroMoroccoMozambiqueMyanmarNamibiaNauruNepalNetherlandsNew ZealandNicaraguaNigerNigeriaNorth AmericaNorwayOECD membersOmanOther small statesPacific island small statesPakistanPalauPanamaPapua New GuineaParaguayPeruPhilippinesPolandPortugalPost-demographic dividendPre-demographic dividendQatarRomaniaRussian FederationRwandaSamoaSan MarinoSao Tome and PrincipeSaudi ArabiaSenegalSerbiaSeychellesSierra LeoneSingaporeSlovak RepublicSloveniaSmall statesSolomon IslandsSomaliaSouth AfricaSouth AsiaSouth Asia (IDA & IBRD)South SudanSpainSri LankaSt. Kitts and NevisSt. LuciaSt. Vincent and the GrenadinesSub-Saharan Africa Sub-Saharan Africa (excluding high income)Sub-Saharan Africa (IDA & IBRD countries)SudanSurinameSwazilandSwedenSwitzerlandSyrian Arab RepublicTajikistanTanzaniaThailandTimor-LesteTogoTongaTrinidad and TobagoTunisiaTurkeyTurkmenistanTuvaluUgandaUkraineUnited Arab EmiratesUnited KingdomUnited StatesUpper middle incomeUruguayUzbekistanVanuatuVenezuela, RBVietnamWest Bank and GazaWorldYemen, Rep.ZambiaZimbabwe Linea del tempo:
Questa scala temporale mostra un grafico dal 1967 anno al 2016 anno. Sub-Saharan Africa (IDA & IBRD countries). I dati fino ad 1966 anno non disponibili. Il numero di osservazioni attuali secondo i date: 50.
La fonte (nome):
Indicatori dello sviluppo mondiale
La fonte (organizzazione):
Estimates Developed by the UN Inter-agency Group for Child Mortality Estimation (UNICEF, WHO, World Bank, UN DESA Population Division) at www.childmortality.org. Projected data are from the United Nations Population Division's World Population Prospects; and may in some cases not be consistent with data before the current year.
Categorie:
Health
sono stati aggiornati
23 apr 2017 anni
Indicatori delle variazioni dei valori per anni
Minima:
56.353
1 gen 2016 anni
Massimo:
152.967
1 gen 1967 anni
Alla data di osservazione
Valore
Variazione assoluta
La variazione rispetto al valore precedente
1 gen 1967 anni
152.967
+152.967
0.0%
1 gen 1968 anni
149.998
-2.97
-1.94%
1 gen 1969 anni
146.161
-3.837
-2.56%
1 gen 1970 anni
144.591
-1.57
-1.07%
1 gen 1971 anni
142.503
-2.088
-1.44%
1 gen 1972 anni
140.42
-2.083
-1.46%
1 gen 1973 anni
138.203
-2.218
-1.58%
1 gen 1974 anni
136.012
-2.191
-1.59%
1 gen 1975 anni
131.059
-4.953
-3.64%
1 gen 1976 anni
128.769
-2.29
-1.75%
1 gen 1977 anni
126.574
-2.195
-1.7%
1 gen 1978 anni
124.401
-2.173
-1.72%
1 gen 1979 anni
122.261
-2.14
-1.72%
1 gen 1980 anni
121.043
-1.218
-1.0%
1 gen 1981 anni
119.647
-1.396
-1.15%
1 gen 1982 anni
117.968
-1.679
-1.4%
1 gen 1983 anni
116.405
-1.563
-1.33%
1 gen 1984 anni
114.975
-1.43
-1.23%
1 gen 1985 anni
113.722
-1.253
-1.09%
1 gen 1986 anni
112.682
-1.04
-0.91%
1 gen 1987 anni
111.831
-0.851
-0.76%
1 gen 1988 anni
110.96
-0.871
-0.78%
1 gen 1989 anni
110.136
-0.824
-0.74%
1 gen 1990 anni
109.339
-0.797
-0.72%
1 gen 1991 anni
108.517
-0.822
-0.75%
1 gen 1992 anni
107.714
-0.802
-0.74%
1 gen 1993 anni
106.886
-0.829
-0.77%
1 gen 1994 anni
106.039
-0.847
-0.79%
1 gen 1995 anni
105.224
-0.815
-0.77%
1 gen 1996 anni
103.975
-1.249
-1.19%
1 gen 1997 anni
102.459
-1.516
-1.46%
1 gen 1998 anni
100.846
-1.613
-1.57%
1 gen 1999 anni
98.937
-1.909
-1.89%
1 gen 2000 anni
96.725
-2.212
-2.24%
1 gen 2001 anni
94.258
-2.467
-2.55%
1 gen 2002 anni
91.531
-2.727
-2.89%
1 gen 2003 anni
88.601
-2.93
-3.2%
1 gen 2004 anni
85.589
-3.012
-3.4%
1 gen 2005 anni
82.558
-3.031
-3.54%
1 gen 2006 anni
79.526
-3.032
-3.67%
1 gen 2007 anni
76.643
-2.883
-3.63%
1 gen 2008 anni
73.774
-2.869
-3.74%
1 gen 2009 anni
71.036
-2.738
-3.71%
1 gen 2010 anni
68.362
-2.674
-3.76%
1 gen 2011 anni
65.959
-2.403
-3.51%
1 gen 2012 anni
63.695
-2.264
-3.43%
1 gen 2013 anni
61.54
-2.155
-3.38%
1 gen 2014 anni
59.707
-1.833
-2.98%
1 gen 2015 anni
57.932
-1.775
-2.97%
1 gen 2016 anni
56.353
-1.579
-2.73%
Classificazione dei paesi secondo i statistiche attuali per anni


Commenti: