29
/it/
it
AIzaSyAYiBZKx7MnpbEhh9jyipgxe19OcubqV5w
April 1, 2024
37578
IDA & IBRD total
IBT
false
2
1
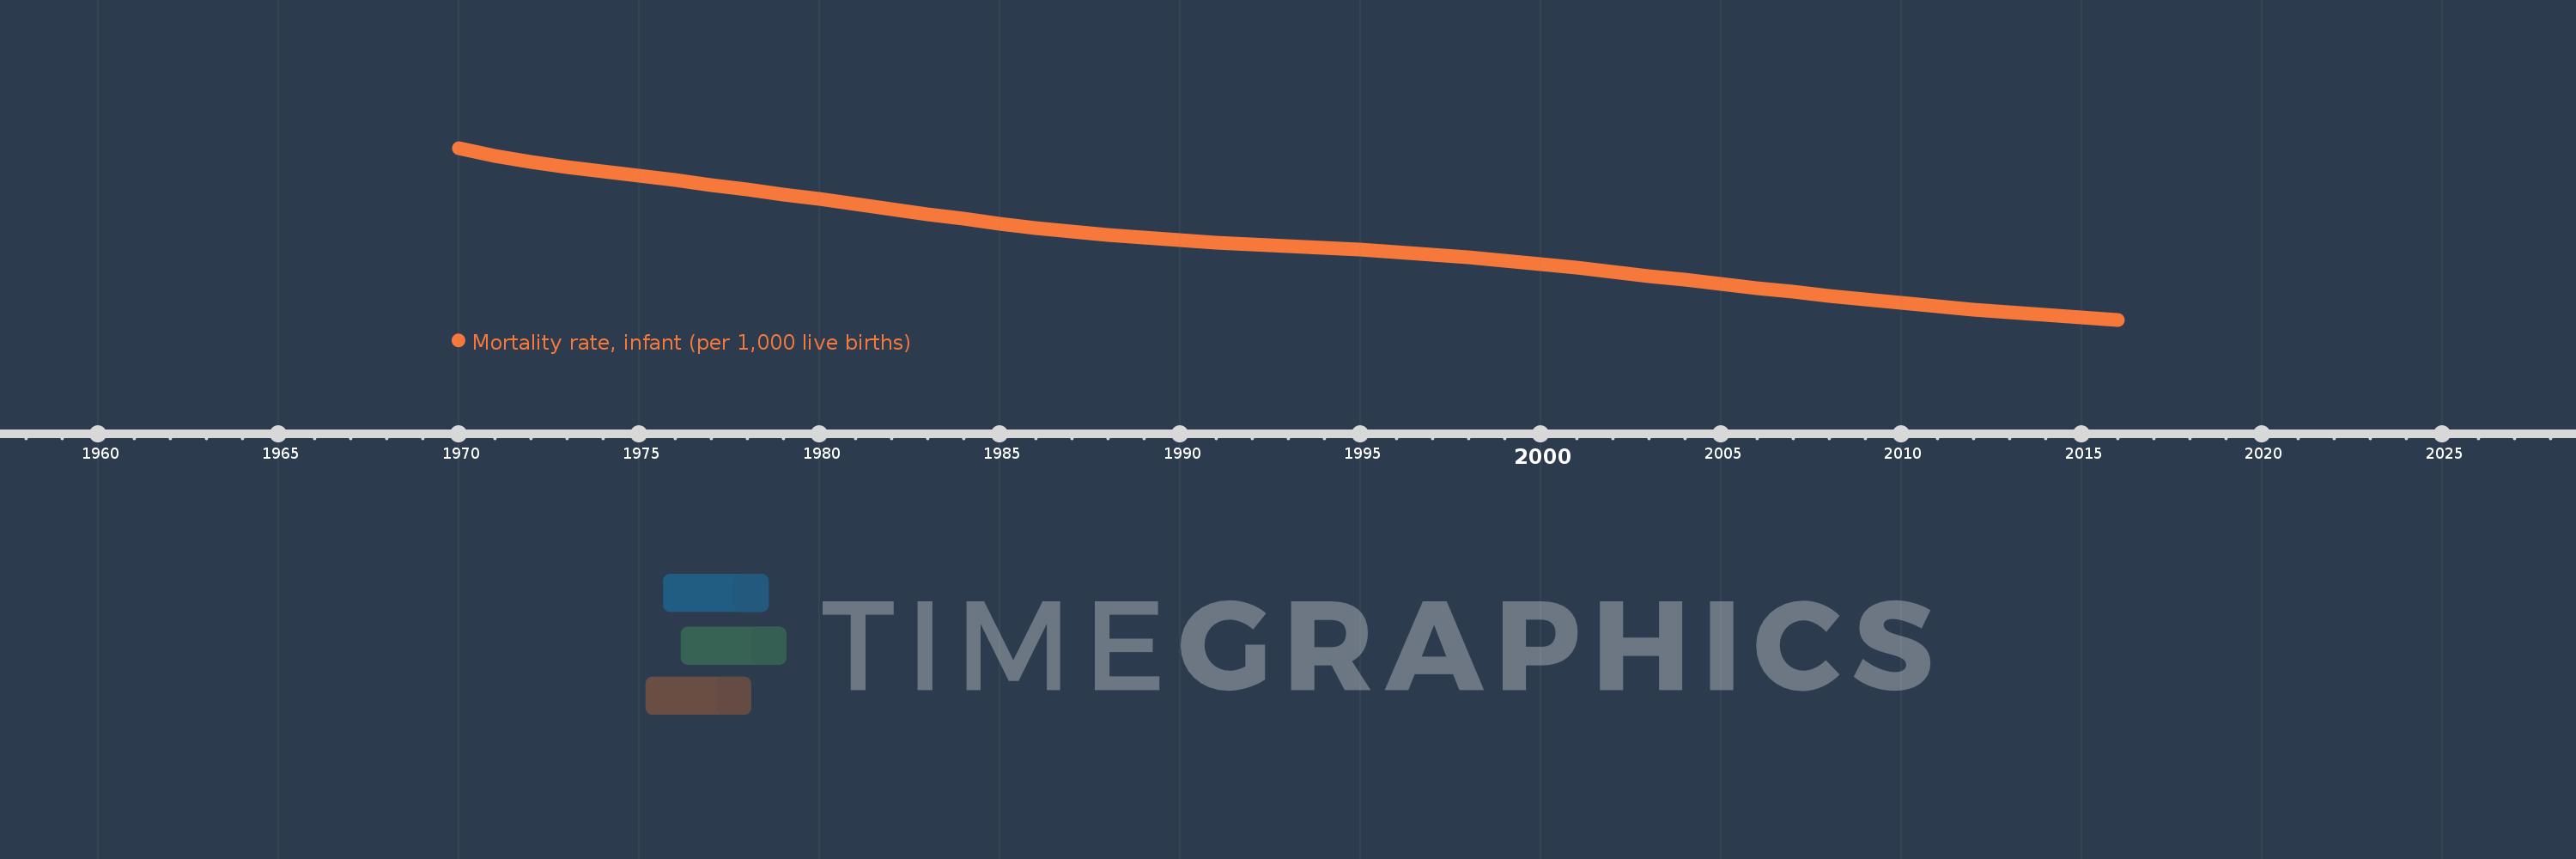
Mortality rate, infant (per 1,000 live births)
2016,2015,2014,2013,2012,2011,2010,2009,2008,2007,2006,2005,2004,2003,2002,2001,2000,1999,1998,1997,1996,1995,1994,1993,1992,1991,1990,1989,1988,1987,1986,1985,1984,1983,1982,1981,1980,1979,1978,1977,1976,1975,1974,1973,1972,1971,1970
Queste statistiche in altri paesi:
AfghanistanAlbaniaAlgeriaAndorraAngolaAntigua and BarbudaArab WorldArgentinaArmeniaAustraliaAustriaAzerbaijanBahamas, TheBahrainBangladeshBarbadosBelarusBelgiumBelizeBeninBhutanBoliviaBosnia and HerzegovinaBotswanaBrazilBrunei DarussalamBulgariaBurkina FasoBurundiCabo VerdeCambodiaCameroonCanadaCaribbean small statesCentral African RepublicCentral Europe and the BalticsChadChileChinaColombiaComorosCongo, Dem. Rep.Congo, Rep.Costa RicaCote d'IvoireCroatiaCubaCyprusCzech RepublicDenmarkDjiboutiDominicaDominican RepublicEarly-demographic dividendEast Asia & PacificEast Asia & Pacific (excluding high income)East Asia & Pacific (IDA & IBRD countries)EcuadorEgypt, Arab Rep.El SalvadorEquatorial GuineaEritreaEstoniaEthiopiaEuro areaEurope & Central AsiaEurope & Central Asia (excluding high income)Europe & Central Asia (IDA & IBRD countries)European UnionFijiFinlandFragile and conflict affected situationsFranceGabonGambia, TheGeorgiaGermanyGhanaGreeceGrenadaGuatemalaGuineaGuinea-BissauGuyanaHaitiHeavily indebted poor countries (HIPC)High incomeHondurasHungaryIBRD onlyIcelandIDA & IBRD totalIDA blendIDA onlyIDA totalIndiaIndonesiaIran, Islamic Rep.IraqIrelandIsraelItalyJamaicaJapanJordanKazakhstanKenyaKiribatiKorea, Dem. People’s Rep.Korea, Rep.KuwaitKyrgyz RepublicLao PDRLate-demographic dividendLatin America & Caribbean Latin America & Caribbean (excluding high income)Latin America & the Caribbean (IDA & IBRD countries)LatviaLeast developed countries: UN classificationLebanonLesothoLiberiaLibyaLithuaniaLow & middle incomeLow incomeLower middle incomeLuxembourgMacedonia, FYRMadagascarMalawiMalaysiaMaldivesMaliMaltaMarshall IslandsMauritaniaMauritiusMexicoMicronesia, Fed. Sts.Middle East & North AfricaMiddle East & North Africa (excluding high income)Middle East & North Africa (IDA & IBRD countries)Middle incomeMoldovaMonacoMongoliaMontenegroMoroccoMozambiqueMyanmarNamibiaNauruNepalNetherlandsNew ZealandNicaraguaNigerNigeriaNorth AmericaNorwayOECD membersOmanOther small statesPacific island small statesPakistanPalauPanamaPapua New GuineaParaguayPeruPhilippinesPolandPortugalPost-demographic dividendPre-demographic dividendQatarRomaniaRussian FederationRwandaSamoaSan MarinoSao Tome and PrincipeSaudi ArabiaSenegalSerbiaSeychellesSierra LeoneSingaporeSlovak RepublicSloveniaSmall statesSolomon IslandsSomaliaSouth AfricaSouth AsiaSouth Asia (IDA & IBRD)South SudanSpainSri LankaSt. Kitts and NevisSt. LuciaSt. Vincent and the GrenadinesSub-Saharan Africa Sub-Saharan Africa (excluding high income)Sub-Saharan Africa (IDA & IBRD countries)SudanSurinameSwazilandSwedenSwitzerlandSyrian Arab RepublicTajikistanTanzaniaThailandTimor-LesteTogoTongaTrinidad and TobagoTunisiaTurkeyTurkmenistanTuvaluUgandaUkraineUnited Arab EmiratesUnited KingdomUnited StatesUpper middle incomeUruguayUzbekistanVanuatuVenezuela, RBVietnamWest Bank and GazaWorldYemen, Rep.ZambiaZimbabwe Linea del tempo:
Questa scala temporale mostra un grafico dal 1970 anno al 2016 anno. IDA & IBRD total. I dati fino ad 1969 anno non disponibili. Il numero di osservazioni attuali secondo i date: 47.
La fonte (nome):
Indicatori dello sviluppo mondiale
La fonte (organizzazione):
Estimates Developed by the UN Inter-agency Group for Child Mortality Estimation (UNICEF, WHO, World Bank, UN DESA Population Division) at www.childmortality.org. Projected data are from the United Nations Population Division's World Population Prospects; and may in some cases not be consistent with data before the current year.
Categorie:
Health
sono stati aggiornati
23 apr 2017 anni
Indicatori delle variazioni dei valori per anni
Minima:
34.959
1 gen 2016 anni
Massimo:
113.58
1 gen 1970 anni
Alla data di osservazione
Valore
Variazione assoluta
La variazione rispetto al valore precedente
1 gen 1970 anni
113.58
+113.58
0.0%
1 gen 1971 anni
109.779
-3.8
-3.35%
1 gen 1972 anni
107.056
-2.724
-2.48%
1 gen 1973 anni
104.977
-2.079
-1.94%
1 gen 1974 anni
102.854
-2.122
-2.02%
1 gen 1975 anni
100.711
-2.143
-2.08%
1 gen 1976 anni
98.79
-1.921
-1.91%
1 gen 1977 anni
96.608
-2.181
-2.21%
1 gen 1978 anni
94.417
-2.191
-2.27%
1 gen 1979 anni
92.266
-2.151
-2.28%
1 gen 1980 anni
90.233
-2.033
-2.2%
1 gen 1981 anni
88.031
-2.203
-2.44%
1 gen 1982 anni
85.646
-2.385
-2.71%
1 gen 1983 anni
83.323
-2.323
-2.71%
1 gen 1984 anni
81.125
-2.198
-2.64%
1 gen 1985 anni
78.89
-2.236
-2.76%
1 gen 1986 anni
76.966
-1.923
-2.44%
1 gen 1987 anni
75.283
-1.684
-2.19%
1 gen 1988 anni
73.773
-1.509
-2.0%
1 gen 1989 anni
72.499
-1.274
-1.73%
1 gen 1990 anni
71.37
-1.129
-1.56%
1 gen 1991 anni
70.382
-0.988
-1.38%
1 gen 1992 anni
69.523
-0.859
-1.22%
1 gen 1993 anni
68.68
-0.843
-1.21%
1 gen 1994 anni
67.79
-0.89
-1.3%
1 gen 1995 anni
66.897
-0.894
-1.32%
1 gen 1996 anni
65.868
-1.029
-1.54%
1 gen 1997 anni
64.726
-1.142
-1.73%
1 gen 1998 anni
63.444
-1.282
-1.98%
1 gen 1999 anni
62.043
-1.401
-2.21%
1 gen 2000 anni
60.474
-1.569
-2.53%
1 gen 2001 anni
58.791
-1.683
-2.78%
1 gen 2002 anni
56.981
-1.81
-3.08%
1 gen 2003 anni
55.067
-1.914
-3.36%
1 gen 2004 anni
53.164
-1.903
-3.46%
1 gen 2005 anni
51.317
-1.848
-3.48%
1 gen 2006 anni
49.393
-1.923
-3.75%
1 gen 2007 anni
47.638
-1.755
-3.55%
1 gen 2008 anni
45.879
-1.759
-3.69%
1 gen 2009 anni
44.235
-1.644
-3.58%
1 gen 2010 anni
42.578
-1.657
-3.74%
1 gen 2011 anni
41.108
-1.47
-3.45%
1 gen 2012 anni
39.599
-1.509
-3.67%
1 gen 2013 anni
38.234
-1.364
-3.44%
1 gen 2014 anni
37.029
-1.205
-3.15%
1 gen 2015 anni
35.916
-1.113
-3.01%
1 gen 2016 anni
34.959
-0.957
-2.67%
Classificazione dei paesi secondo i statistiche attuali per anni


Commenti: