29
/it/
it
AIzaSyAYiBZKx7MnpbEhh9jyipgxe19OcubqV5w
April 1, 2024
50243
Middle East & North Africa (IDA & IBRD countries)
TMN
false
2
1
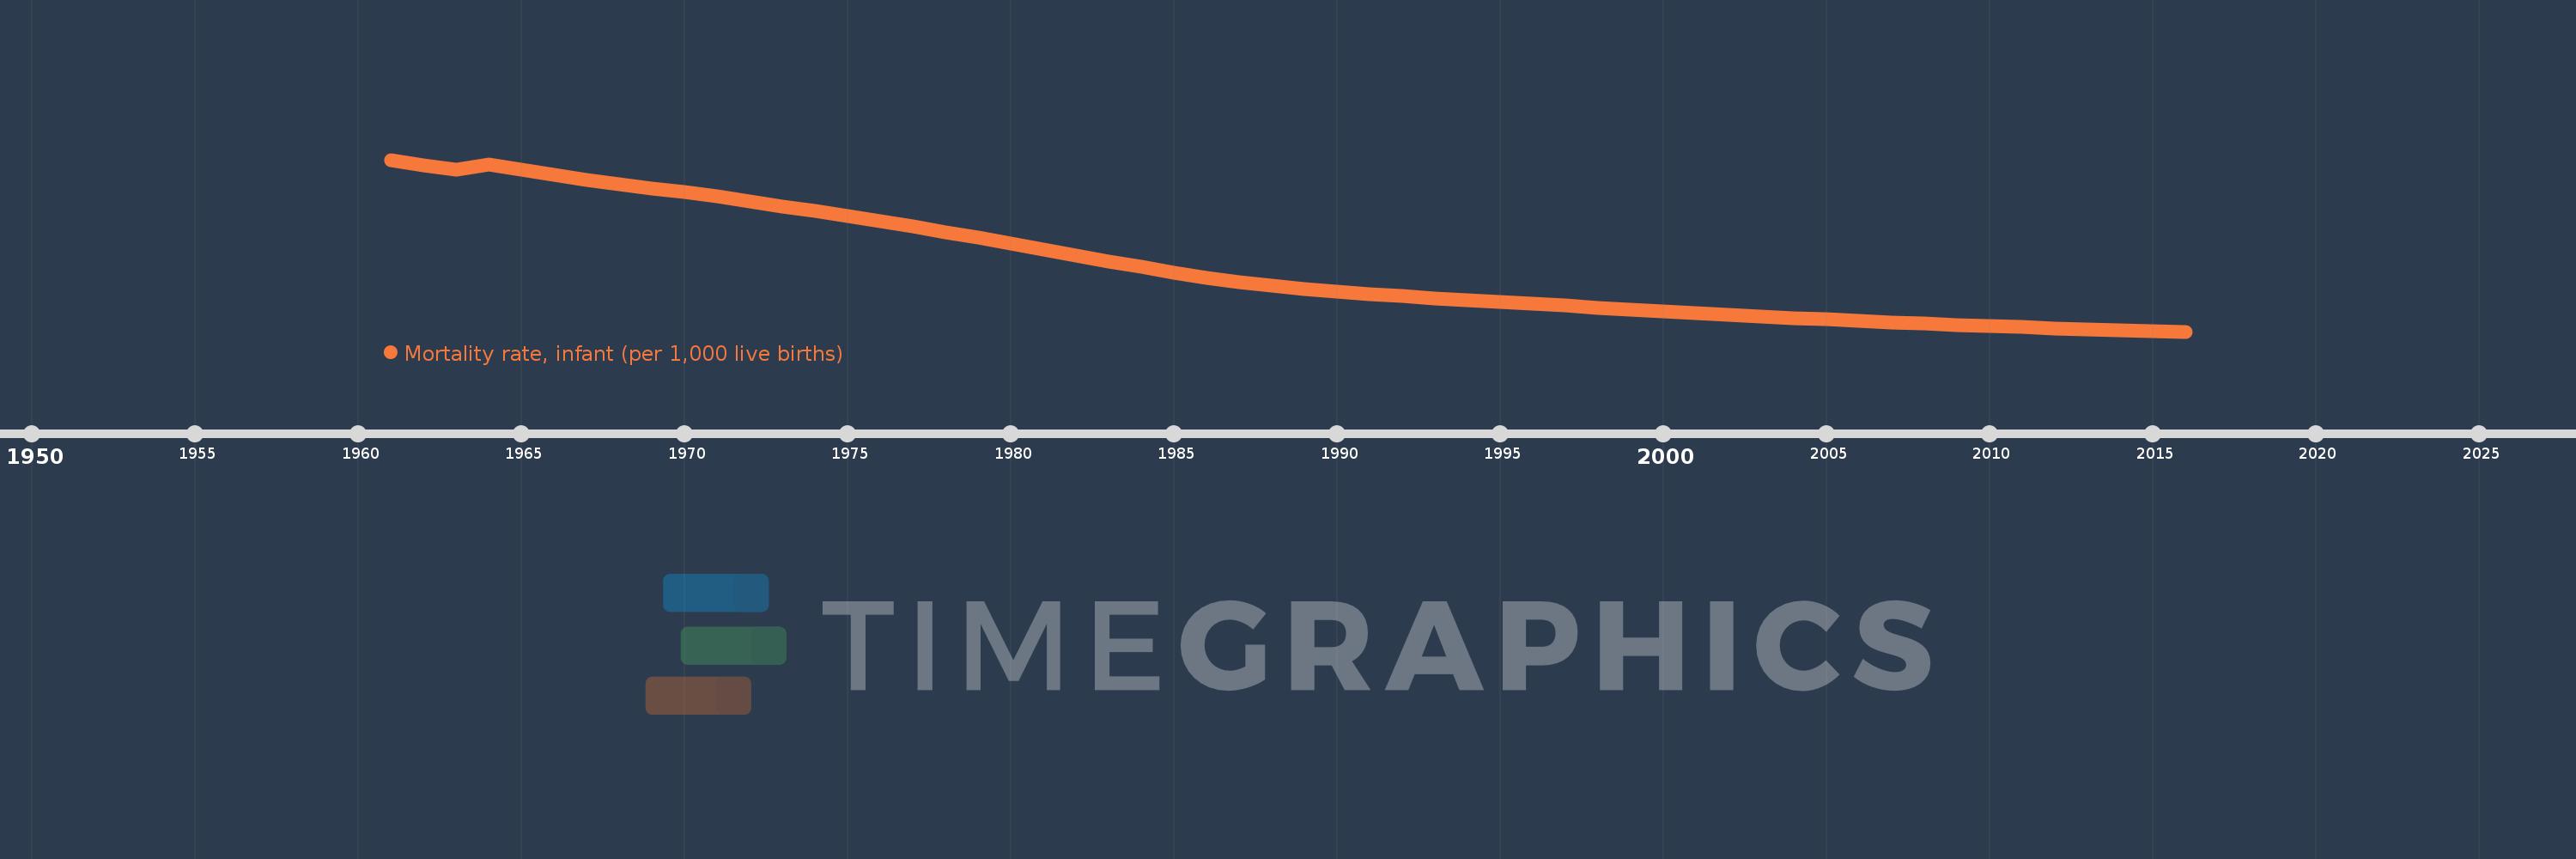
Mortality rate, infant (per 1,000 live births)
2016,2015,2014,2013,2012,2011,2010,2009,2008,2007,2006,2005,2004,2003,2002,2001,2000,1999,1998,1997,1996,1995,1994,1993,1992,1991,1990,1989,1988,1987,1986,1985,1984,1983,1982,1981,1980,1979,1978,1977,1976,1975,1974,1973,1972,1971,1970,1969,1968,1967,1966,1965,1964,1963,1962,1961
Queste statistiche in altri paesi:
AfghanistanAlbaniaAlgeriaAndorraAngolaAntigua and BarbudaArab WorldArgentinaArmeniaAustraliaAustriaAzerbaijanBahamas, TheBahrainBangladeshBarbadosBelarusBelgiumBelizeBeninBhutanBoliviaBosnia and HerzegovinaBotswanaBrazilBrunei DarussalamBulgariaBurkina FasoBurundiCabo VerdeCambodiaCameroonCanadaCaribbean small statesCentral African RepublicCentral Europe and the BalticsChadChileChinaColombiaComorosCongo, Dem. Rep.Congo, Rep.Costa RicaCote d'IvoireCroatiaCubaCyprusCzech RepublicDenmarkDjiboutiDominicaDominican RepublicEarly-demographic dividendEast Asia & PacificEast Asia & Pacific (excluding high income)East Asia & Pacific (IDA & IBRD countries)EcuadorEgypt, Arab Rep.El SalvadorEquatorial GuineaEritreaEstoniaEthiopiaEuro areaEurope & Central AsiaEurope & Central Asia (excluding high income)Europe & Central Asia (IDA & IBRD countries)European UnionFijiFinlandFragile and conflict affected situationsFranceGabonGambia, TheGeorgiaGermanyGhanaGreeceGrenadaGuatemalaGuineaGuinea-BissauGuyanaHaitiHeavily indebted poor countries (HIPC)High incomeHondurasHungaryIBRD onlyIcelandIDA & IBRD totalIDA blendIDA onlyIDA totalIndiaIndonesiaIran, Islamic Rep.IraqIrelandIsraelItalyJamaicaJapanJordanKazakhstanKenyaKiribatiKorea, Dem. People’s Rep.Korea, Rep.KuwaitKyrgyz RepublicLao PDRLate-demographic dividendLatin America & Caribbean Latin America & Caribbean (excluding high income)Latin America & the Caribbean (IDA & IBRD countries)LatviaLeast developed countries: UN classificationLebanonLesothoLiberiaLibyaLithuaniaLow & middle incomeLow incomeLower middle incomeLuxembourgMacedonia, FYRMadagascarMalawiMalaysiaMaldivesMaliMaltaMarshall IslandsMauritaniaMauritiusMexicoMicronesia, Fed. Sts.Middle East & North AfricaMiddle East & North Africa (excluding high income)Middle East & North Africa (IDA & IBRD countries)Middle incomeMoldovaMonacoMongoliaMontenegroMoroccoMozambiqueMyanmarNamibiaNauruNepalNetherlandsNew ZealandNicaraguaNigerNigeriaNorth AmericaNorwayOECD membersOmanOther small statesPacific island small statesPakistanPalauPanamaPapua New GuineaParaguayPeruPhilippinesPolandPortugalPost-demographic dividendPre-demographic dividendQatarRomaniaRussian FederationRwandaSamoaSan MarinoSao Tome and PrincipeSaudi ArabiaSenegalSerbiaSeychellesSierra LeoneSingaporeSlovak RepublicSloveniaSmall statesSolomon IslandsSomaliaSouth AfricaSouth AsiaSouth Asia (IDA & IBRD)South SudanSpainSri LankaSt. Kitts and NevisSt. LuciaSt. Vincent and the GrenadinesSub-Saharan Africa Sub-Saharan Africa (excluding high income)Sub-Saharan Africa (IDA & IBRD countries)SudanSurinameSwazilandSwedenSwitzerlandSyrian Arab RepublicTajikistanTanzaniaThailandTimor-LesteTogoTongaTrinidad and TobagoTunisiaTurkeyTurkmenistanTuvaluUgandaUkraineUnited Arab EmiratesUnited KingdomUnited StatesUpper middle incomeUruguayUzbekistanVanuatuVenezuela, RBVietnamWest Bank and GazaWorldYemen, Rep.ZambiaZimbabwe Linea del tempo:
Questa scala temporale mostra un grafico dal 1961 anno al 2016 anno. Middle East & North Africa (IDA & IBRD countries). I dati fino ad 1960 anno non disponibili. Il numero di osservazioni attuali secondo i date: 56.
La fonte (nome):
Indicatori dello sviluppo mondiale
La fonte (organizzazione):
Estimates Developed by the UN Inter-agency Group for Child Mortality Estimation (UNICEF, WHO, World Bank, UN DESA Population Division) at www.childmortality.org. Projected data are from the United Nations Population Division's World Population Prospects; and may in some cases not be consistent with data before the current year.
Categorie:
Health
sono stati aggiornati
23 apr 2017 anni
Indicatori delle variazioni dei valori per anni
Minima:
20.952
1 gen 2016 anni
Massimo:
166.407
1 gen 1961 anni
Alla data di osservazione
Valore
Variazione assoluta
La variazione rispetto al valore precedente
1 gen 1961 anni
166.407
+166.407
0.0%
1 gen 1962 anni
161.53
-4.877
-2.93%
1 gen 1963 anni
158.061
-3.468
-2.15%
1 gen 1964 anni
162.302
+4.241
2.68%
1 gen 1965 anni
157.816
-4.486
-2.76%
1 gen 1966 anni
153.597
-4.219
-2.67%
1 gen 1967 anni
149.609
-3.988
-2.6%
1 gen 1968 anni
145.877
-3.733
-2.49%
1 gen 1969 anni
142.349
-3.528
-2.42%
1 gen 1970 anni
138.927
-3.422
-2.4%
1 gen 1971 anni
135.618
-3.309
-2.38%
1 gen 1972 anni
130.944
-4.674
-3.45%
1 gen 1973 anni
127.123
-3.821
-2.92%
1 gen 1974 anni
123.223
-3.9
-3.07%
1 gen 1975 anni
119.042
-4.181
-3.39%
1 gen 1976 anni
114.641
-4.401
-3.7%
1 gen 1977 anni
110.014
-4.627
-4.04%
1 gen 1978 anni
105.192
-4.822
-4.38%
1 gen 1979 anni
100.241
-4.951
-4.71%
1 gen 1980 anni
95.266
-4.975
-4.96%
1 gen 1981 anni
90.368
-4.898
-5.14%
1 gen 1982 anni
85.451
-4.917
-5.44%
1 gen 1983 anni
80.528
-4.923
-5.76%
1 gen 1984 anni
75.653
-4.875
-6.05%
1 gen 1985 anni
71.018
-4.636
-6.13%
1 gen 1986 anni
66.751
-4.266
-6.01%
1 gen 1987 anni
63.046
-3.706
-5.55%
1 gen 1988 anni
59.789
-3.256
-5.17%
1 gen 1989 anni
57.035
-2.754
-4.61%
1 gen 1990 anni
54.698
-2.337
-4.1%
1 gen 1991 anni
52.667
-2.03
-3.71%
1 gen 1992 anni
50.881
-1.786
-3.39%
1 gen 1993 anni
49.179
-1.702
-3.34%
1 gen 1994 anni
47.601
-1.578
-3.21%
1 gen 1995 anni
46.012
-1.589
-3.34%
1 gen 1996 anni
44.424
-1.588
-3.45%
1 gen 1997 anni
42.845
-1.579
-3.56%
1 gen 1998 anni
41.296
-1.549
-3.61%
1 gen 1999 anni
39.75
-1.547
-3.75%
1 gen 2000 anni
38.24
-1.51
-3.8%
1 gen 2001 anni
36.753
-1.487
-3.89%
1 gen 2002 anni
35.312
-1.441
-3.92%
1 gen 2003 anni
33.884
-1.427
-4.04%
1 gen 2004 anni
32.567
-1.318
-3.89%
1 gen 2005 anni
31.243
-1.324
-4.07%
1 gen 2006 anni
29.976
-1.266
-4.05%
1 gen 2007 anni
28.788
-1.189
-3.97%
1 gen 2008 anni
27.654
-1.133
-3.94%
1 gen 2009 anni
26.557
-1.097
-3.97%
1 gen 2010 anni
25.521
-1.036
-3.9%
1 gen 2011 anni
24.591
-0.93
-3.64%
1 gen 2012 anni
23.712
-0.88
-3.58%
1 gen 2013 anni
22.964
-0.747
-3.15%
1 gen 2014 anni
22.231
-0.733
-3.19%
1 gen 2015 anni
21.556
-0.675
-3.04%
1 gen 2016 anni
20.952
-0.604
-2.8%
Classificazione dei paesi secondo i statistiche attuali per anni


Commenti: