29
/it/
it
AIzaSyAYiBZKx7MnpbEhh9jyipgxe19OcubqV5w
April 1, 2024
59696
Sub-Saharan Africa (excluding high income)
SSA
false
2
1
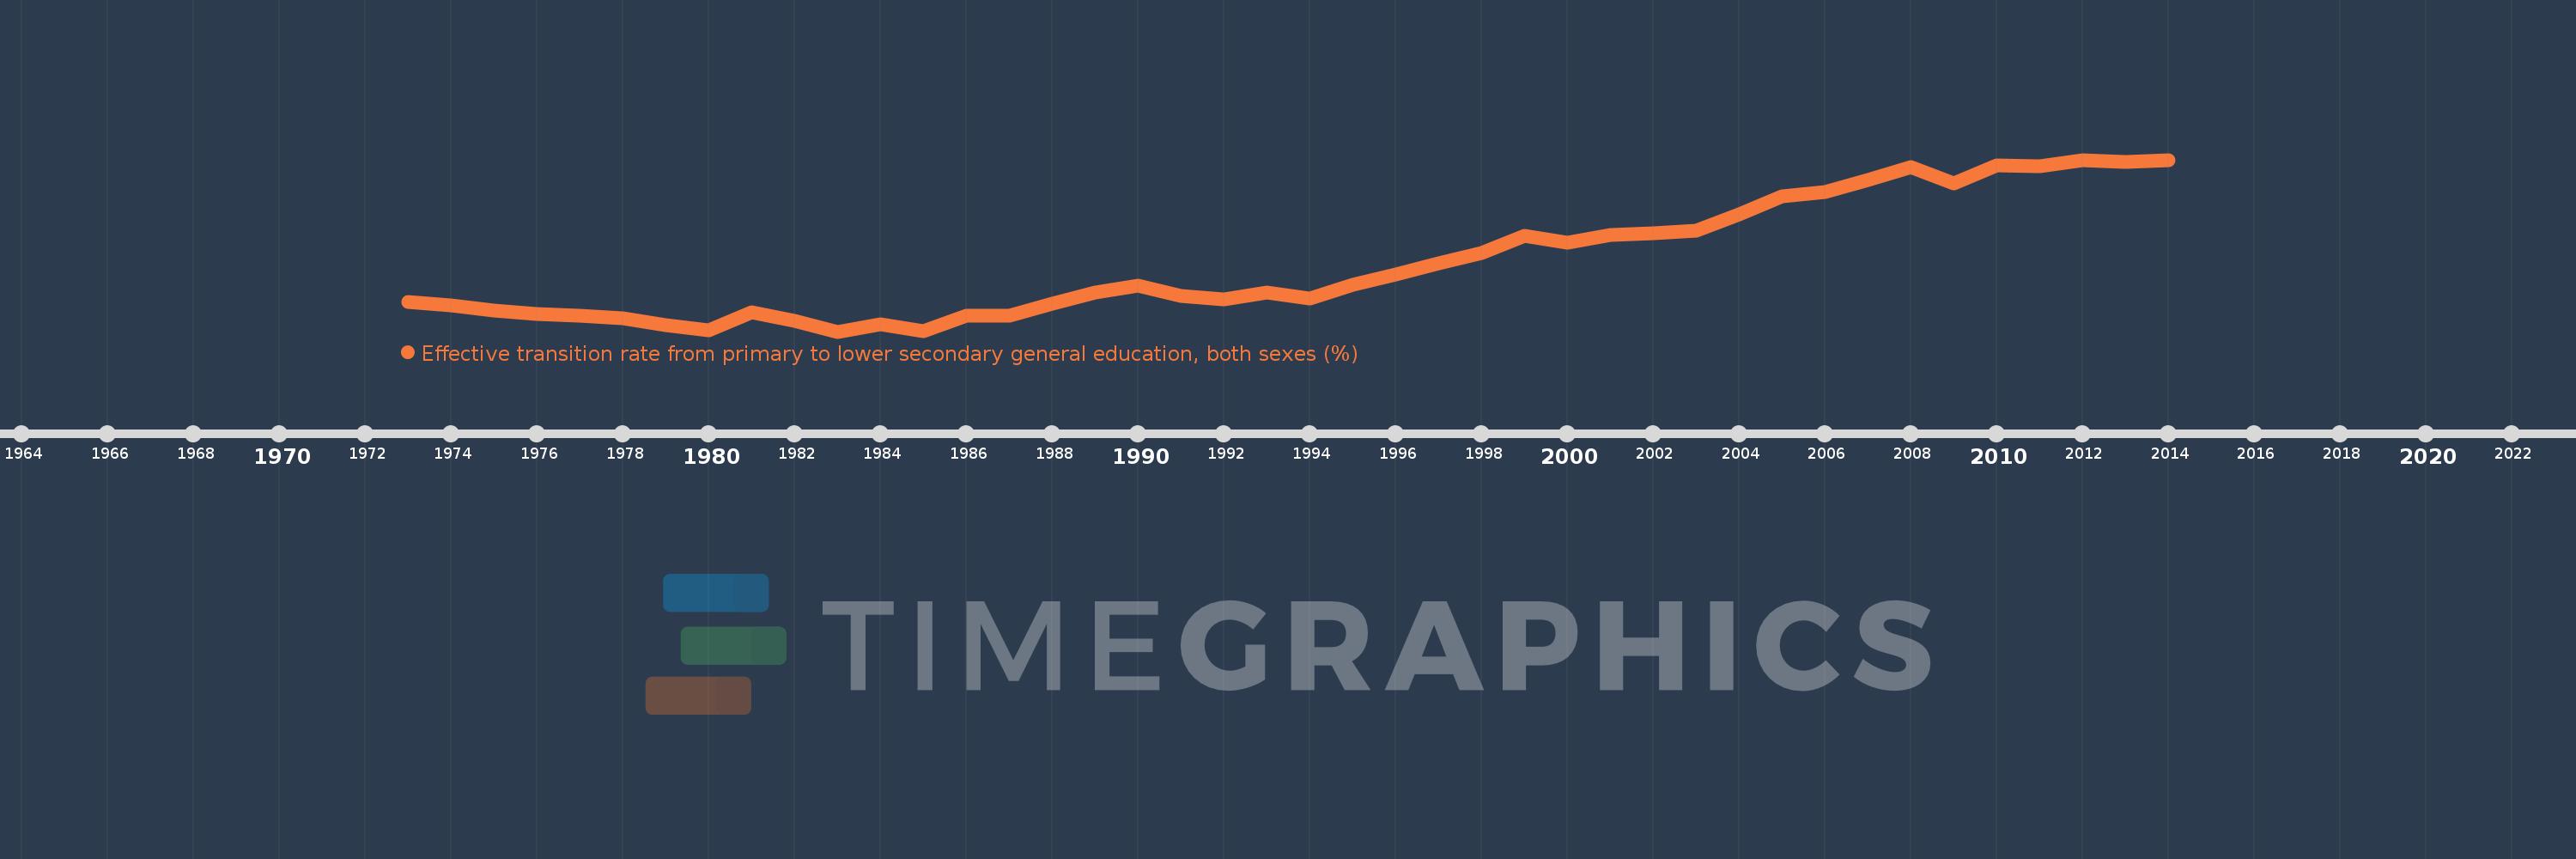
Effective transition rate from primary to lower secondary general education, both sexes (%)
2014,2013,2012,2011,2010,2009,2008,2007,2006,2005,2004,2003,2002,2001,2000,1999,1998,1997,1996,1995,1994,1993,1992,1991,1990,1989,1988,1987,1986,1985,1984,1983,1982,1981,1980,1979,1978,1977,1976,1975,1974,1973
Queste statistiche in altri paesi:
AfghanistanAlbaniaAlgeriaAngolaAntigua and BarbudaArab WorldArgentinaArmeniaArubaAustriaAzerbaijanBahamas, TheBahrainBangladeshBarbadosBelarusBelgiumBelizeBeninBermudaBhutanBoliviaBosnia and HerzegovinaBotswanaBrazilBritish Virgin IslandsBrunei DarussalamBulgariaBurkina FasoBurundiCabo VerdeCambodiaCameroonCaribbean small statesCayman IslandsCentral African RepublicCentral Europe and the BalticsChadChileChinaColombiaComorosCongo, Dem. Rep.Congo, Rep.Costa RicaCote d'IvoireCroatiaCubaCyprusCzech RepublicDenmarkDjiboutiDominicaDominican RepublicEarly-demographic dividendEast Asia & PacificEast Asia & Pacific (excluding high income)East Asia & Pacific (IDA & IBRD countries)EcuadorEgypt, Arab Rep.El SalvadorEquatorial GuineaEritreaEstoniaEthiopiaEuro areaEurope & Central AsiaEurope & Central Asia (excluding high income)Europe & Central Asia (IDA & IBRD countries)European UnionFijiFinlandFragile and conflict affected situationsFranceGabonGambia, TheGeorgiaGermanyGhanaGreeceGrenadaGuatemalaGuineaGuinea-BissauGuyanaHaitiHeavily indebted poor countries (HIPC)High incomeHondurasHong Kong SAR, ChinaHungaryIBRD onlyIcelandIDA & IBRD totalIDA blendIDA onlyIDA totalIndiaIndonesiaIran, Islamic Rep.IraqIsraelItalyJamaicaJapanJordanKazakhstanKenyaKiribatiKorea, Rep.KuwaitKyrgyz RepublicLao PDRLate-demographic dividendLatin America & Caribbean Latin America & Caribbean (excluding high income)Latin America & the Caribbean (IDA & IBRD countries)LatviaLeast developed countries: UN classificationLebanonLesothoLiberiaLibyaLiechtensteinLithuaniaLow & middle incomeLow incomeLower middle incomeLuxembourgMacao SAR, ChinaMacedonia, FYRMadagascarMalawiMalaysiaMaldivesMaliMaltaMarshall IslandsMauritaniaMauritiusMexicoMiddle East & North AfricaMiddle East & North Africa (excluding high income)Middle East & North Africa (IDA & IBRD countries)Middle incomeMoldovaMonacoMongoliaMoroccoMozambiqueMyanmarNamibiaNepalNetherlandsNicaraguaNigerNorwayOECD membersOmanOther small statesPacific island small statesPakistanPalauPanamaParaguayPeruPhilippinesPolandPortugalPost-demographic dividendPre-demographic dividendQatarRomaniaRussian FederationRwandaSamoaSan MarinoSao Tome and PrincipeSaudi ArabiaSenegalSerbiaSeychellesSierra LeoneSingaporeSlovak RepublicSloveniaSmall statesSolomon IslandsSouth AfricaSouth AsiaSouth Asia (IDA & IBRD)SpainSri LankaSt. Kitts and NevisSt. LuciaSt. Vincent and the GrenadinesSub-Saharan Africa Sub-Saharan Africa (excluding high income)Sub-Saharan Africa (IDA & IBRD countries)SudanSurinameSwazilandSwedenSwitzerlandSyrian Arab RepublicTajikistanTanzaniaThailandTimor-LesteTogoTongaTrinidad and TobagoTunisiaTurkeyTurks and Caicos IslandsTuvaluUgandaUkraineUnited Arab EmiratesUpper middle incomeUruguayUzbekistanVanuatuVenezuela, RBVietnamWest Bank and GazaWorldYemen, Rep.ZambiaZimbabwe Linea del tempo:
Questa scala temporale mostra un grafico dal 1973 anno al 2014 anno. Sub-Saharan Africa (excluding high income). I dati fino ad 1972 anno non disponibili. Il numero di osservazioni attuali secondo i date: 42.
La fonte (nome):
Indicatori dello sviluppo mondiale
La fonte (organizzazione):
UNESCO Institute for Statistics
Categorie:
Education
sono stati aggiornati
23 apr 2017 anni
Indicatori delle variazioni dei valori per anni
Minima:
59.893
1 gen 1983 anni
Massimo:
78.867
1 gen 2014 anni
Alla data di osservazione
Valore
Variazione assoluta
La variazione rispetto al valore precedente
1 gen 1973 anni
63.211
+63.211
0.0%
1 gen 1974 anni
62.8
-0.412
-0.65%
1 gen 1975 anni
62.192
-0.608
-0.97%
1 gen 1976 anni
61.795
-0.396
-0.64%
1 gen 1977 anni
61.65
-0.145
-0.23%
1 gen 1978 anni
61.323
-0.327
-0.53%
1 gen 1979 anni
60.591
-0.733
-1.19%
1 gen 1980 anni
59.988
-0.602
-0.99%
1 gen 1981 anni
61.983
+1.995
3.33%
1 gen 1982 anni
61.081
-0.902
-1.46%
1 gen 1983 anni
59.893
-1.188
-1.94%
1 gen 1984 anni
60.663
+0.77
1.28%
1 gen 1985 anni
59.926
-0.737
-1.21%
1 gen 1986 anni
61.61
+1.684
2.81%
1 gen 1987 anni
61.64
+0.03
0.05%
1 gen 1988 anni
62.97
+1.329
2.16%
1 gen 1989 anni
64.223
+1.254
1.99%
1 gen 1990 anni
64.941
+0.718
1.12%
1 gen 1991 anni
63.844
-1.097
-1.69%
1 gen 1992 anni
63.466
-0.378
-0.59%
1 gen 1993 anni
64.195
+0.73
1.15%
1 gen 1994 anni
63.58
-0.615
-0.96%
1 gen 1995 anni
65.056
+1.476
2.32%
1 gen 1996 anni
66.196
+1.14
1.75%
1 gen 1997 anni
67.453
+1.257
1.9%
1 gen 1998 anni
68.547
+1.095
1.62%
1 gen 1999 anni
70.432
+1.884
2.75%
1 gen 2000 anni
69.734
-0.697
-0.99%
1 gen 2001 anni
70.564
+0.83
1.19%
1 gen 2002 anni
70.709
+0.145
0.21%
1 gen 2003 anni
71.038
+0.328
0.46%
1 gen 2004 anni
72.818
+1.78
2.51%
1 gen 2005 anni
74.827
+2.009
2.76%
1 gen 2006 anni
75.307
+0.48
0.64%
1 gen 2007 anni
76.626
+1.319
1.75%
1 gen 2008 anni
78.078
+1.452
1.89%
1 gen 2009 anni
76.291
-1.787
-2.29%
1 gen 2010 anni
78.214
+1.923
2.52%
1 gen 2011 anni
78.196
-0.018
-0.02%
1 gen 2012 anni
78.809
+0.613
0.78%
1 gen 2013 anni
78.618
-0.191
-0.24%
1 gen 2014 anni
78.867
+0.249
0.32%
Classificazione dei paesi secondo i statistiche attuali per anni


Commenti: