29
/it/
it
AIzaSyAYiBZKx7MnpbEhh9jyipgxe19OcubqV5w
April 1, 2024
110811
Congo, Rep.
COG
true
2
1
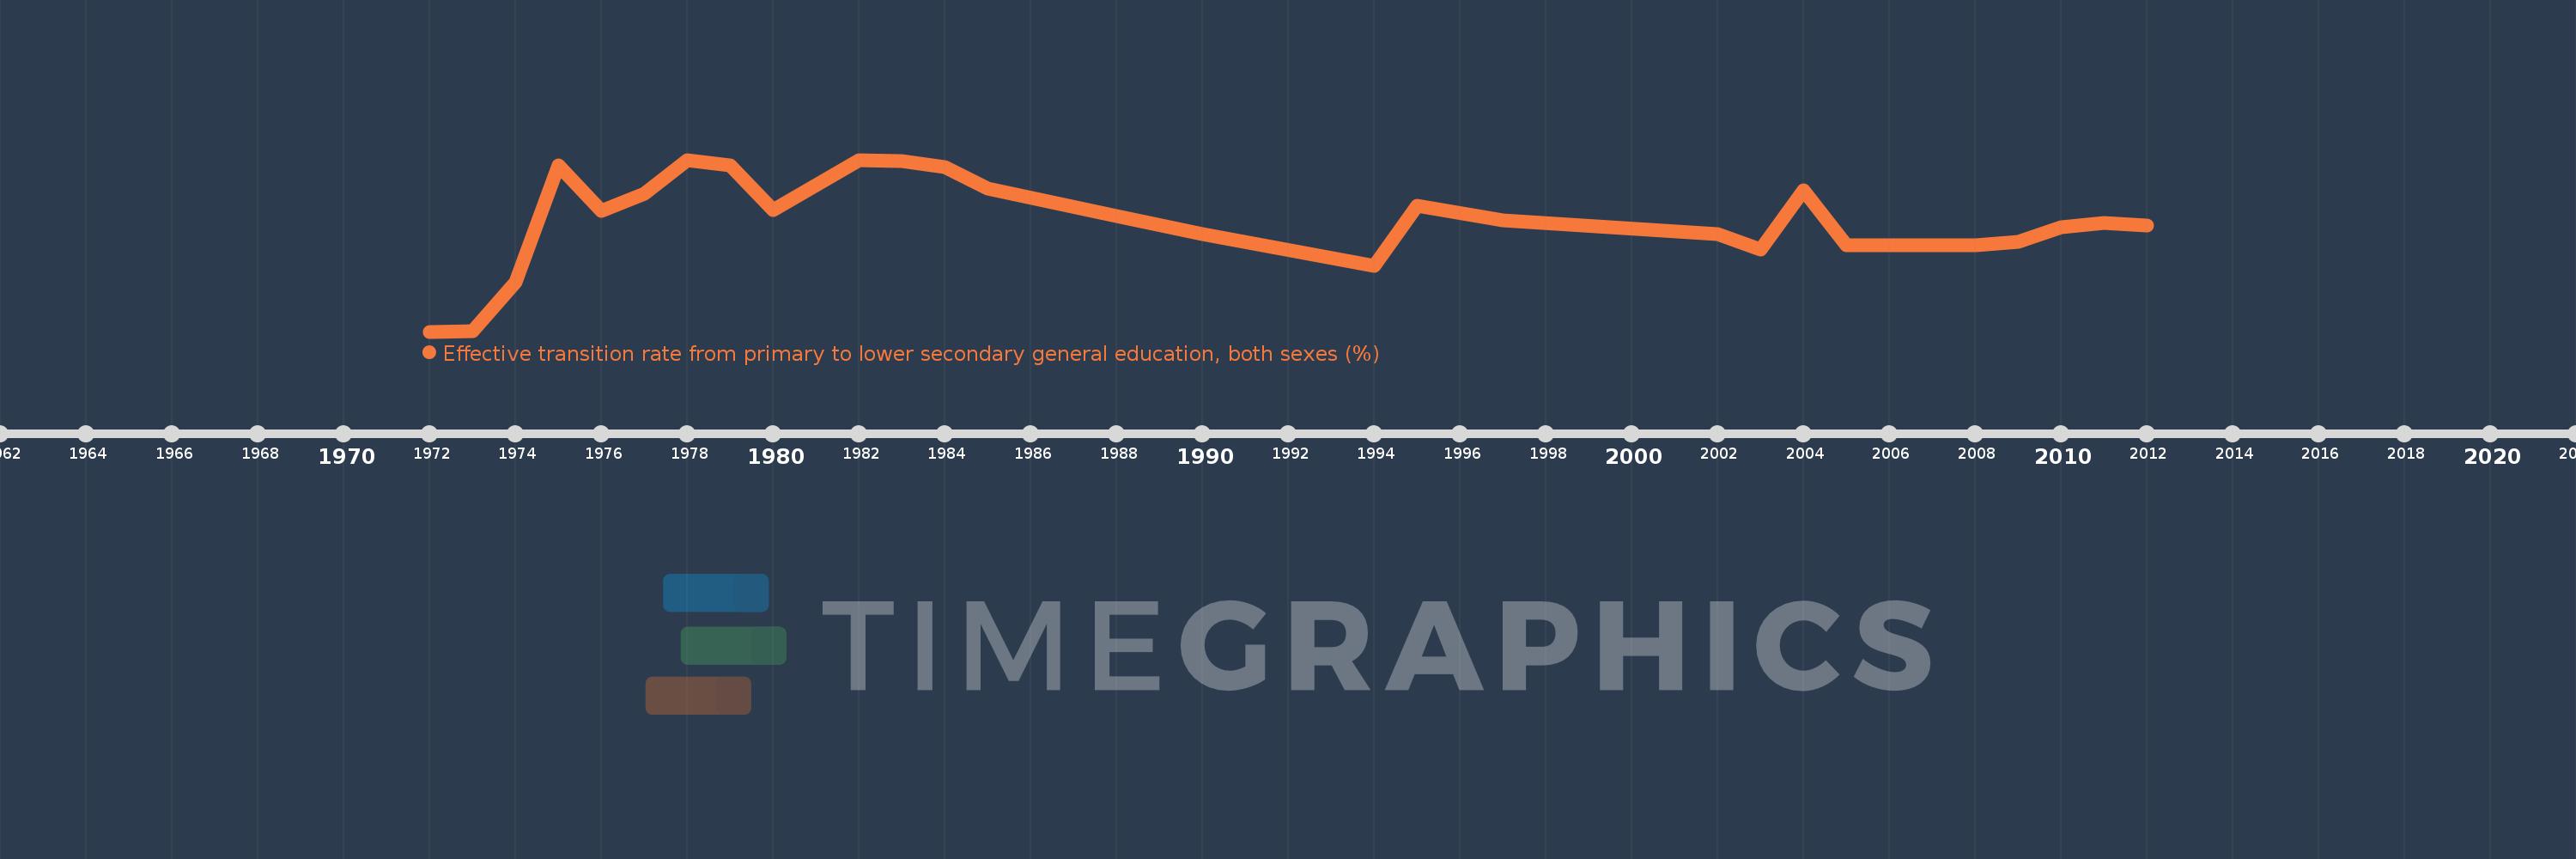
Effective transition rate from primary to lower secondary general education, both sexes (%)
2012,2011,2010,2009,2008,2005,2004,2003,2002,1997,1995,1994,1990,1988,1985,1984,1983,1982,1980,1979,1978,1977,1976,1975,1974,1973,1972
Queste statistiche in altri paesi:
AfghanistanAlbaniaAlgeriaAngolaAntigua and BarbudaArab WorldArgentinaArmeniaArubaAustriaAzerbaijanBahamas, TheBahrainBangladeshBarbadosBelarusBelgiumBelizeBeninBermudaBhutanBoliviaBosnia and HerzegovinaBotswanaBrazilBritish Virgin IslandsBrunei DarussalamBulgariaBurkina FasoBurundiCabo VerdeCambodiaCameroonCaribbean small statesCayman IslandsCentral African RepublicCentral Europe and the BalticsChadChileChinaColombiaComorosCongo, Dem. Rep.Congo, Rep.Costa RicaCote d'IvoireCroatiaCubaCyprusCzech RepublicDenmarkDjiboutiDominicaDominican RepublicEarly-demographic dividendEast Asia & PacificEast Asia & Pacific (excluding high income)East Asia & Pacific (IDA & IBRD countries)EcuadorEgypt, Arab Rep.El SalvadorEquatorial GuineaEritreaEstoniaEthiopiaEuro areaEurope & Central AsiaEurope & Central Asia (excluding high income)Europe & Central Asia (IDA & IBRD countries)European UnionFijiFinlandFragile and conflict affected situationsFranceGabonGambia, TheGeorgiaGermanyGhanaGreeceGrenadaGuatemalaGuineaGuinea-BissauGuyanaHaitiHeavily indebted poor countries (HIPC)High incomeHondurasHong Kong SAR, ChinaHungaryIBRD onlyIcelandIDA & IBRD totalIDA blendIDA onlyIDA totalIndiaIndonesiaIran, Islamic Rep.IraqIsraelItalyJamaicaJapanJordanKazakhstanKenyaKiribatiKorea, Rep.KuwaitKyrgyz RepublicLao PDRLate-demographic dividendLatin America & Caribbean Latin America & Caribbean (excluding high income)Latin America & the Caribbean (IDA & IBRD countries)LatviaLeast developed countries: UN classificationLebanonLesothoLiberiaLibyaLiechtensteinLithuaniaLow & middle incomeLow incomeLower middle incomeLuxembourgMacao SAR, ChinaMacedonia, FYRMadagascarMalawiMalaysiaMaldivesMaliMaltaMarshall IslandsMauritaniaMauritiusMexicoMiddle East & North AfricaMiddle East & North Africa (excluding high income)Middle East & North Africa (IDA & IBRD countries)Middle incomeMoldovaMonacoMongoliaMoroccoMozambiqueMyanmarNamibiaNepalNetherlandsNicaraguaNigerNorwayOECD membersOmanOther small statesPacific island small statesPakistanPalauPanamaParaguayPeruPhilippinesPolandPortugalPost-demographic dividendPre-demographic dividendQatarRomaniaRussian FederationRwandaSamoaSan MarinoSao Tome and PrincipeSaudi ArabiaSenegalSerbiaSeychellesSierra LeoneSingaporeSlovak RepublicSloveniaSmall statesSolomon IslandsSouth AfricaSouth AsiaSouth Asia (IDA & IBRD)SpainSri LankaSt. Kitts and NevisSt. LuciaSt. Vincent and the GrenadinesSub-Saharan Africa Sub-Saharan Africa (excluding high income)Sub-Saharan Africa (IDA & IBRD countries)SudanSurinameSwazilandSwedenSwitzerlandSyrian Arab RepublicTajikistanTanzaniaThailandTimor-LesteTogoTongaTrinidad and TobagoTunisiaTurkeyTurks and Caicos IslandsTuvaluUgandaUkraineUnited Arab EmiratesUpper middle incomeUruguayUzbekistanVanuatuVenezuela, RBVietnamWest Bank and GazaWorldYemen, Rep.ZambiaZimbabwe Linea del tempo:
Questa scala temporale mostra un grafico dal 1972 anno al 2012 anno. Congo, Rep.. I dati fino ad 1971 anno non disponibili. Il numero di osservazioni attuali secondo i date: 27.
La fonte (nome):
Indicatori dello sviluppo mondiale
La fonte (organizzazione):
UNESCO Institute for Statistics
Categorie:
Education
sono stati aggiornati
23 apr 2017 anni
Indicatori delle variazioni dei valori per anni
Minima:
42.419
1 gen 1972 anni
Massimo:
97.332
1 gen 1982 anni
Alla data di osservazione
Valore
Variazione assoluta
La variazione rispetto al valore precedente
1 gen 1972 anni
42.419
+42.419
0.0%
1 gen 1973 anni
42.645
+0.226
0.53%
1 gen 1974 anni
58.335
+15.69
36.79%
1 gen 1975 anni
95.53
+37.195
63.76%
1 gen 1976 anni
81.07
-14.46
-15.14%
1 gen 1977 anni
86.555
+5.485
6.77%
1 gen 1978 anni
97.212
+10.658
12.31%
1 gen 1979 anni
95.47
-1.742
-1.79%
1 gen 1980 anni
81.304
-14.166
-14.84%
1 gen 1982 anni
97.332
+16.028
19.71%
1 gen 1983 anni
96.825
-0.507
-0.52%
1 gen 1984 anni
95.092
-1.733
-1.79%
1 gen 1985 anni
88.034
-7.058
-7.42%
1 gen 1988 anni
79.392
-8.642
-9.82%
1 gen 1990 anni
73.548
-5.844
-7.36%
1 gen 1994 anni
63.472
-10.076
-13.7%
1 gen 1995 anni
82.706
+19.234
30.3%
1 gen 1997 anni
77.846
-4.86
-5.88%
1 gen 2002 anni
73.519
-4.327
-5.56%
1 gen 2003 anni
68.66
-4.859
-6.61%
1 gen 2004 anni
87.68
+19.02
27.7%
1 gen 2005 anni
70.109
-17.572
-20.04%
1 gen 2008 anni
70.056
-0.053
-0.08%
1 gen 2009 anni
71.224
+1.169
1.67%
1 gen 2010 anni
75.798
+4.573
6.42%
1 gen 2011 anni
77.275
+1.477
1.95%
1 gen 2012 anni
76.435
-0.84
-1.09%
Classificazione dei paesi secondo i statistiche attuali per anni


Commenti: