29
/it/
it
AIzaSyAYiBZKx7MnpbEhh9jyipgxe19OcubqV5w
April 1, 2024
55192
Post-demographic dividend
PST
false
2
1
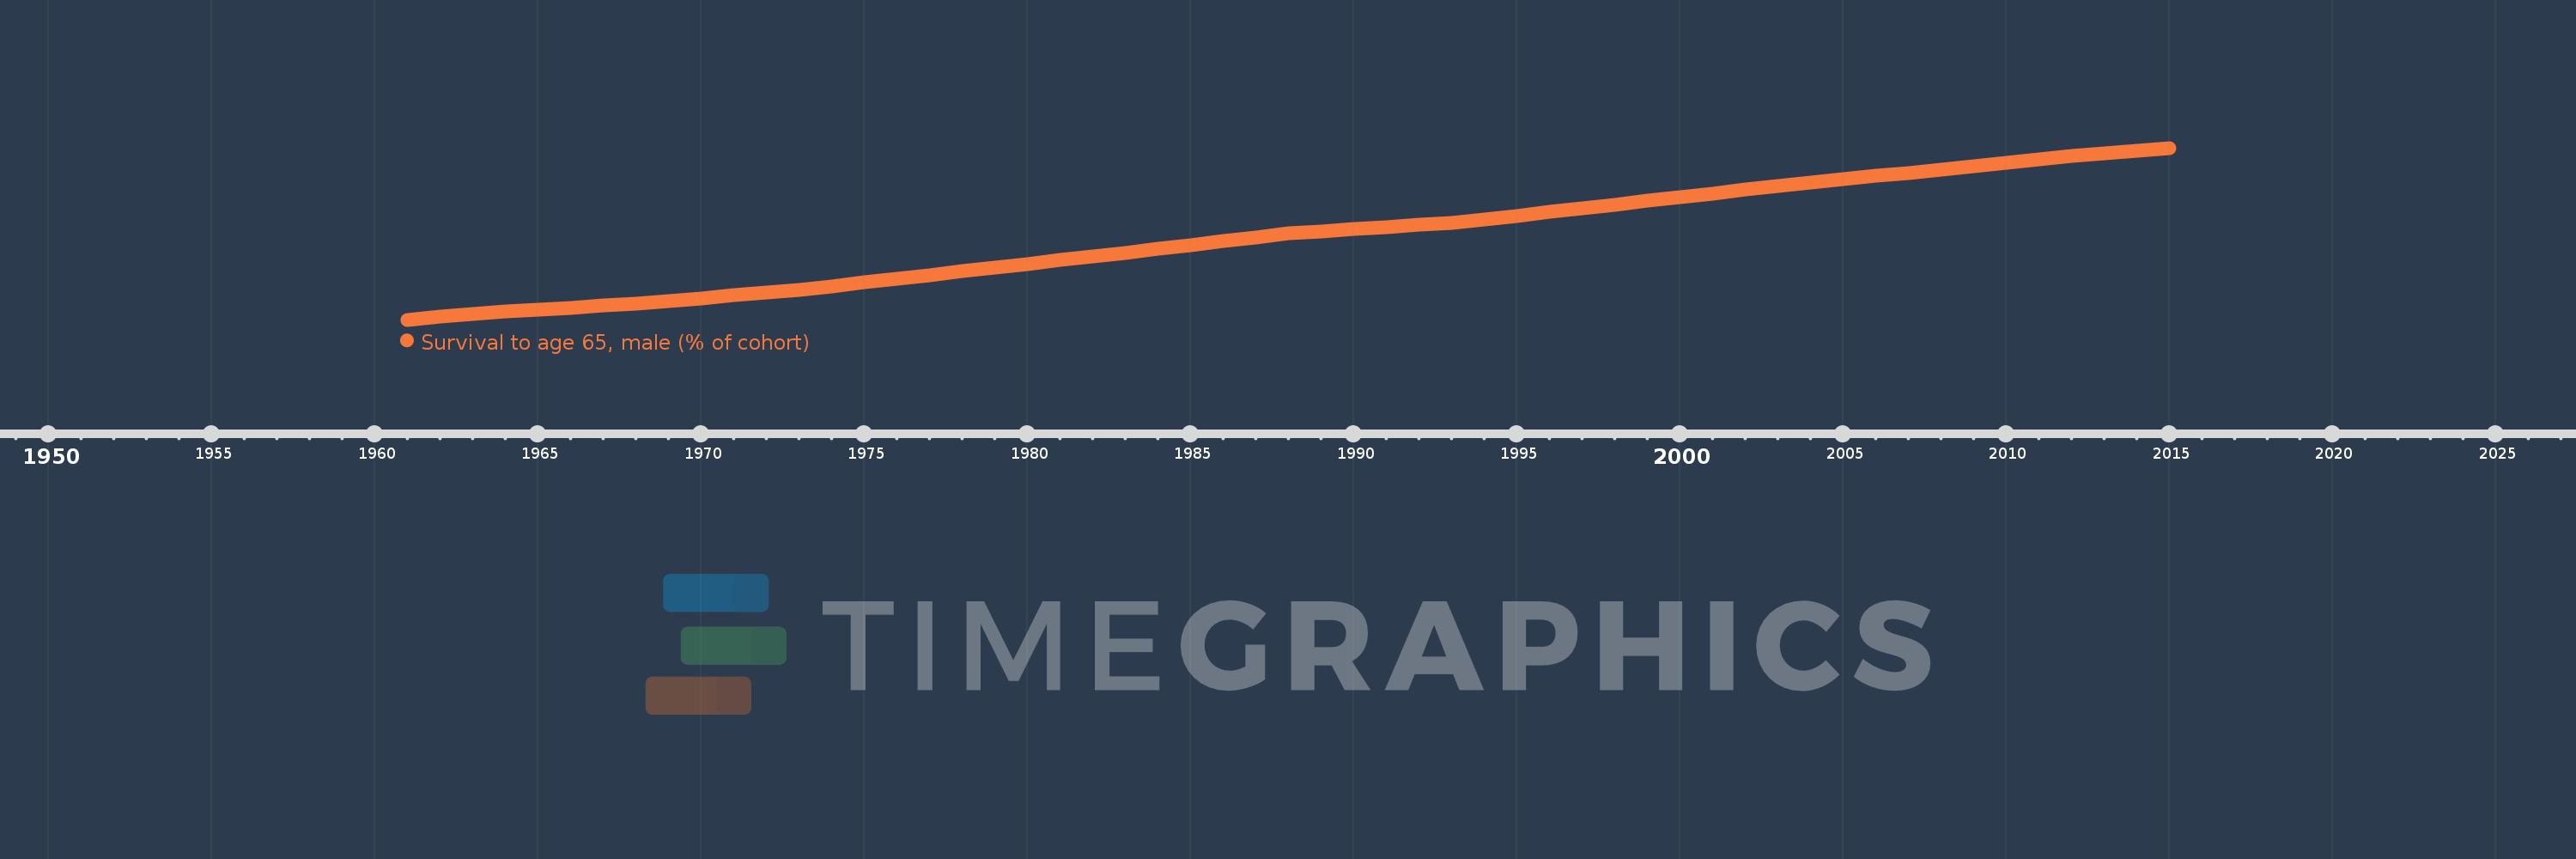
Survival to age 65, male (% of cohort)
2015,2014,2013,2012,2011,2010,2009,2008,2007,2006,2005,2004,2003,2002,2001,2000,1999,1998,1997,1996,1995,1994,1993,1992,1991,1990,1989,1988,1987,1986,1985,1984,1983,1982,1981,1980,1979,1978,1977,1976,1975,1974,1973,1972,1971,1970,1969,1968,1967,1966,1965,1964,1963,1962,1961
Queste statistiche in altri paesi:
AfghanistanAlbaniaAlgeriaAngolaAntigua and BarbudaArab WorldArgentinaArmeniaArubaAustraliaAustriaAzerbaijanBahamas, TheBahrainBangladeshBarbadosBelarusBelgiumBelizeBeninBhutanBoliviaBosnia and HerzegovinaBotswanaBrazilBrunei DarussalamBulgariaBurkina FasoBurundiCabo VerdeCambodiaCameroonCanadaCaribbean small statesCentral African RepublicCentral Europe and the BalticsChadChannel IslandsChileChinaColombiaComorosCongo, Dem. Rep.Congo, Rep.Costa RicaCote d'IvoireCroatiaCubaCuracaoCyprusCzech RepublicDenmarkDjiboutiDominican RepublicEarly-demographic dividendEast Asia & PacificEast Asia & Pacific (excluding high income)East Asia & Pacific (IDA & IBRD countries)EcuadorEgypt, Arab Rep.El SalvadorEquatorial GuineaEritreaEstoniaEthiopiaEuro areaEurope & Central AsiaEurope & Central Asia (excluding high income)Europe & Central Asia (IDA & IBRD countries)European UnionFijiFinlandFragile and conflict affected situationsFranceFrench PolynesiaGabonGambia, TheGeorgiaGermanyGhanaGreeceGrenadaGuamGuatemalaGuineaGuinea-BissauGuyanaHaitiHeavily indebted poor countries (HIPC)High incomeHondurasHong Kong SAR, ChinaHungaryIBRD onlyIcelandIDA & IBRD totalIDA blendIDA onlyIDA totalIndiaIndonesiaIran, Islamic Rep.IraqIrelandIsraelItalyJamaicaJapanJordanKazakhstanKenyaKiribatiKorea, Dem. People’s Rep.Korea, Rep.KuwaitKyrgyz RepublicLao PDRLate-demographic dividendLatin America & Caribbean Latin America & Caribbean (excluding high income)Latin America & the Caribbean (IDA & IBRD countries)LatviaLeast developed countries: UN classificationLebanonLesothoLiberiaLibyaLithuaniaLow & middle incomeLow incomeLower middle incomeLuxembourgMacao SAR, ChinaMacedonia, FYRMadagascarMalawiMalaysiaMaldivesMaliMaltaMauritaniaMauritiusMexicoMicronesia, Fed. Sts.Middle East & North AfricaMiddle East & North Africa (excluding high income)Middle East & North Africa (IDA & IBRD countries)Middle incomeMoldovaMongoliaMontenegroMoroccoMozambiqueMyanmarNamibiaNepalNetherlandsNew CaledoniaNew ZealandNicaraguaNigerNigeriaNorth AmericaNorwayOECD membersOmanOther small statesPacific island small statesPakistanPanamaPapua New GuineaParaguayPeruPhilippinesPolandPortugalPost-demographic dividendPre-demographic dividendPuerto RicoQatarRomaniaRussian FederationRwandaSamoaSao Tome and PrincipeSaudi ArabiaSenegalSerbiaSeychellesSierra LeoneSingaporeSlovak RepublicSloveniaSmall statesSolomon IslandsSomaliaSouth AfricaSouth AsiaSouth Asia (IDA & IBRD)South SudanSpainSri LankaSt. LuciaSt. Vincent and the GrenadinesSub-Saharan Africa Sub-Saharan Africa (excluding high income)Sub-Saharan Africa (IDA & IBRD countries)SudanSurinameSwazilandSwedenSwitzerlandSyrian Arab RepublicTajikistanTanzaniaThailandTimor-LesteTogoTongaTrinidad and TobagoTunisiaTurkeyTurkmenistanUgandaUkraineUnited Arab EmiratesUnited KingdomUnited StatesUpper middle incomeUruguayUzbekistanVanuatuVenezuela, RBVietnamVirgin Islands (U.S.)West Bank and GazaWorldYemen, Rep.ZambiaZimbabwe Linea del tempo:
Questa scala temporale mostra un grafico dal 1961 anno al 2015 anno. Post-demographic dividend. I dati fino ad 1960 anno non disponibili. Il numero di osservazioni attuali secondo i date: 55.
La fonte (nome):
Indicatori dello sviluppo mondiale
La fonte (organizzazione):
United Nations Population Division. World Population Prospects. New York, United Nations, Department of Economic and Social Affairs (advanced Excel tables). Available at http://esa.un.org/wpp/unpp/panel_population.htm.
Categorie:
Health, Gender
sono stati aggiornati
23 apr 2017 anni
Indicatori delle variazioni dei valori per anni
Minima:
65.138
1 gen 1961 anni
Massimo:
83.312
1 gen 2015 anni
Alla data di osservazione
Valore
Variazione assoluta
La variazione rispetto al valore precedente
1 gen 1961 anni
65.138
+65.138
0.0%
1 gen 1962 anni
65.46
+0.322
0.49%
1 gen 1963 anni
65.79
+0.33
0.5%
1 gen 1964 anni
65.997
+0.207
0.31%
1 gen 1965 anni
66.207
+0.21
0.32%
1 gen 1966 anni
66.417
+0.211
0.32%
1 gen 1967 anni
66.615
+0.197
0.3%
1 gen 1968 anni
66.815
+0.2
0.3%
1 gen 1969 anni
67.11
+0.295
0.44%
1 gen 1970 anni
67.414
+0.304
0.45%
1 gen 1971 anni
67.709
+0.295
0.44%
1 gen 1972 anni
67.998
+0.289
0.43%
1 gen 1973 anni
68.289
+0.291
0.43%
1 gen 1974 anni
68.676
+0.387
0.57%
1 gen 1975 anni
69.076
+0.4
0.58%
1 gen 1976 anni
69.477
+0.402
0.58%
1 gen 1977 anni
69.875
+0.398
0.57%
1 gen 1978 anni
70.28
+0.405
0.58%
1 gen 1979 anni
70.661
+0.381
0.54%
1 gen 1980 anni
71.046
+0.385
0.54%
1 gen 1981 anni
71.433
+0.387
0.54%
1 gen 1982 anni
71.821
+0.388
0.54%
1 gen 1983 anni
72.21
+0.389
0.54%
1 gen 1984 anni
72.617
+0.406
0.56%
1 gen 1985 anni
73.026
+0.409
0.56%
1 gen 1986 anni
73.438
+0.412
0.56%
1 gen 1987 anni
73.851
+0.413
0.56%
1 gen 1988 anni
74.264
+0.413
0.56%
1 gen 1989 anni
74.483
+0.219
0.29%
1 gen 1990 anni
74.705
+0.223
0.3%
1 gen 1991 anni
74.93
+0.225
0.3%
1 gen 1992 anni
75.159
+0.229
0.31%
1 gen 1993 anni
75.385
+0.226
0.3%
1 gen 1994 anni
75.765
+0.38
0.5%
1 gen 1995 anni
76.151
+0.386
0.51%
1 gen 1996 anni
76.539
+0.388
0.51%
1 gen 1997 anni
76.93
+0.391
0.51%
1 gen 1998 anni
77.315
+0.385
0.5%
1 gen 1999 anni
77.71
+0.395
0.51%
1 gen 2000 anni
78.106
+0.395
0.51%
1 gen 2001 anni
78.506
+0.4
0.51%
1 gen 2002 anni
78.917
+0.411
0.52%
1 gen 2003 anni
79.331
+0.414
0.52%
1 gen 2004 anni
79.672
+0.341
0.43%
1 gen 2005 anni
80.01
+0.339
0.42%
1 gen 2006 anni
80.346
+0.335
0.42%
1 gen 2007 anni
80.682
+0.336
0.42%
1 gen 2008 anni
81.019
+0.336
0.42%
1 gen 2009 anni
81.376
+0.357
0.44%
1 gen 2010 anni
81.727
+0.351
0.43%
1 gen 2011 anni
82.075
+0.348
0.43%
1 gen 2012 anni
82.424
+0.349
0.42%
1 gen 2013 anni
82.763
+0.34
0.41%
1 gen 2014 anni
83.04
+0.276
0.33%
1 gen 2015 anni
83.312
+0.272
0.33%
Classificazione dei paesi secondo i statistiche attuali per anni


Commenti: