29
/it/
it
AIzaSyAYiBZKx7MnpbEhh9jyipgxe19OcubqV5w
April 1, 2024
169530
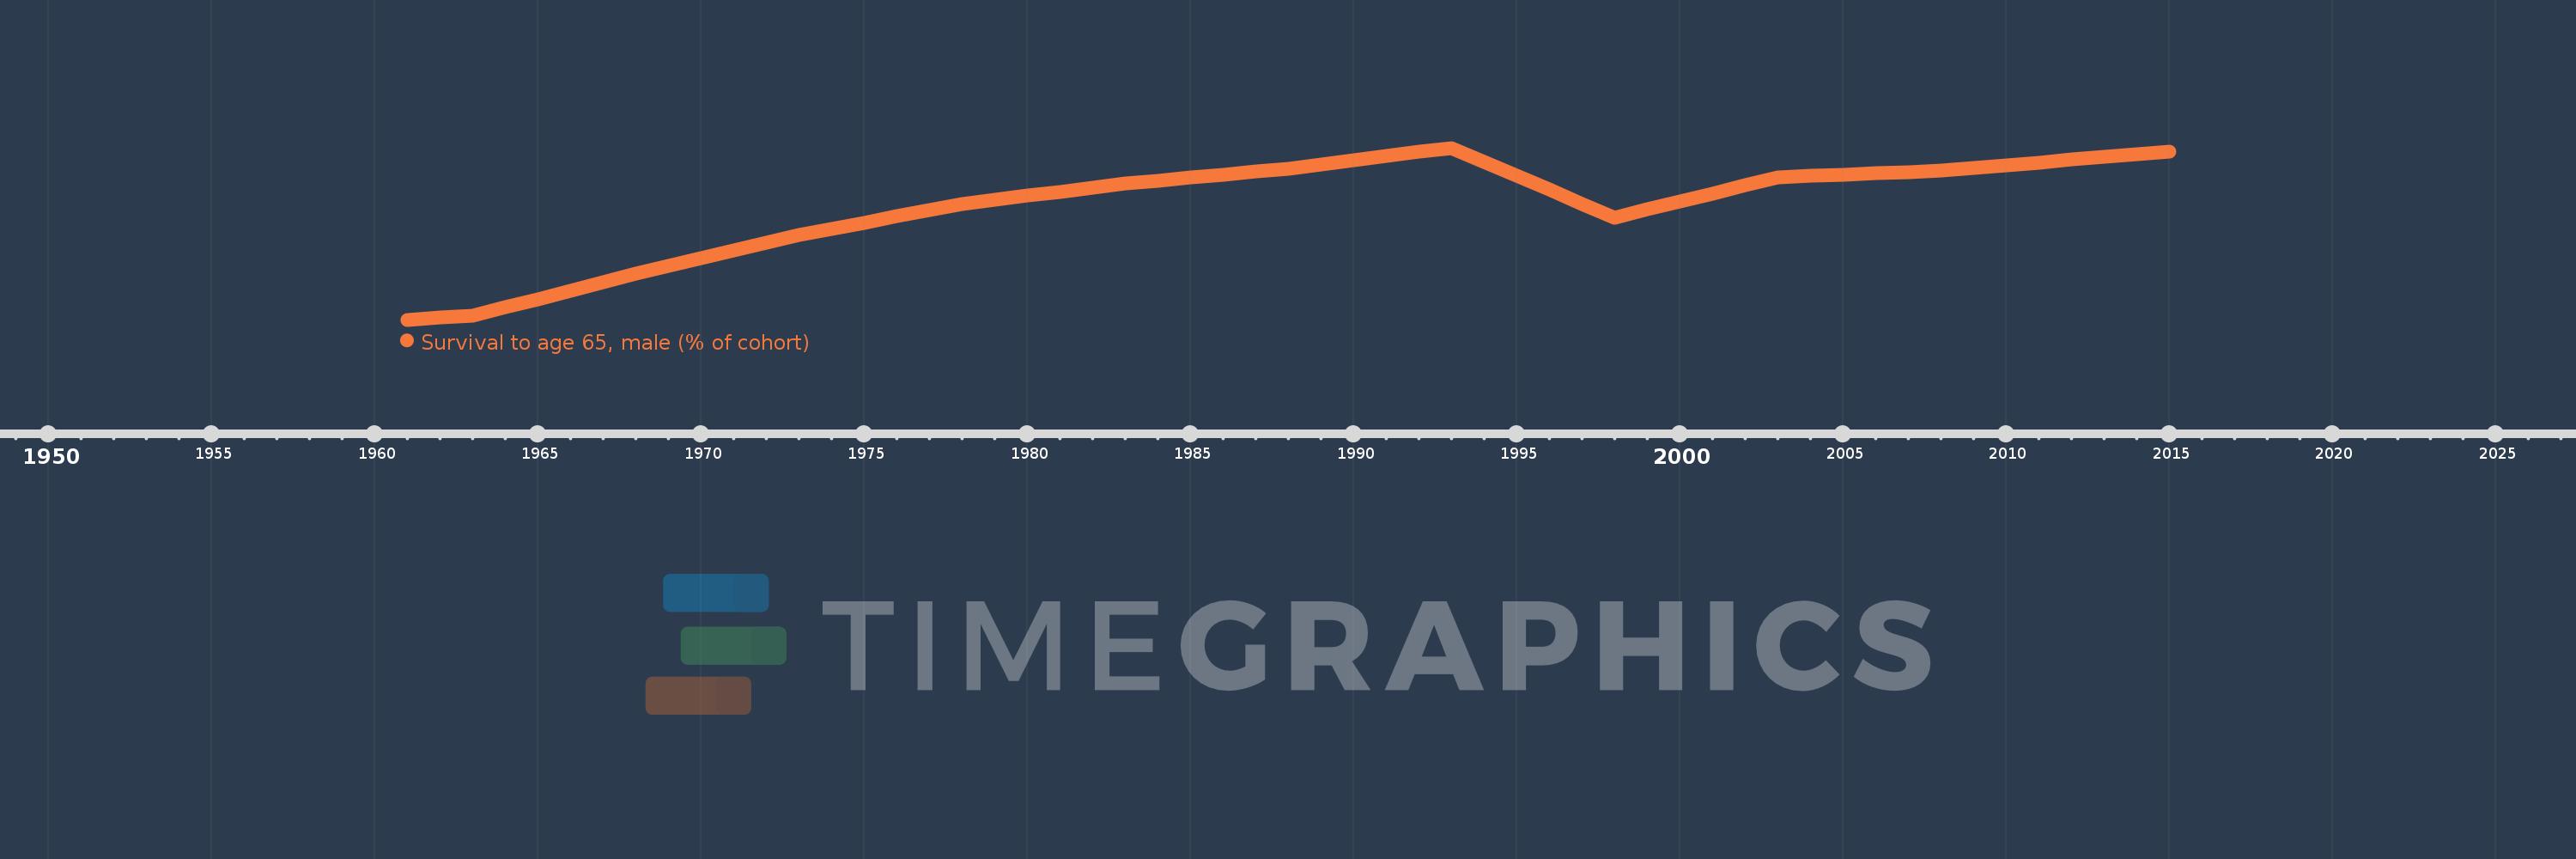
Korea, Dem. People’s Rep.
PRK
true
2
1
Survival to age 65, male (% of cohort)
2015,2014,2013,2012,2011,2010,2009,2008,2007,2006,2005,2004,2003,2002,2001,2000,1999,1998,1997,1996,1995,1994,1993,1992,1991,1990,1989,1988,1987,1986,1985,1984,1983,1982,1981,1980,1979,1978,1977,1976,1975,1974,1973,1972,1971,1970,1969,1968,1967,1966,1965,1964,1963,1962,1961
Queste statistiche in altri paesi:
AfghanistanAlbaniaAlgeriaAngolaAntigua and BarbudaArab WorldArgentinaArmeniaArubaAustraliaAustriaAzerbaijanBahamas, TheBahrainBangladeshBarbadosBelarusBelgiumBelizeBeninBhutanBoliviaBosnia and HerzegovinaBotswanaBrazilBrunei DarussalamBulgariaBurkina FasoBurundiCabo VerdeCambodiaCameroonCanadaCaribbean small statesCentral African RepublicCentral Europe and the BalticsChadChannel IslandsChileChinaColombiaComorosCongo, Dem. Rep.Congo, Rep.Costa RicaCote d'IvoireCroatiaCubaCuracaoCyprusCzech RepublicDenmarkDjiboutiDominican RepublicEarly-demographic dividendEast Asia & PacificEast Asia & Pacific (excluding high income)East Asia & Pacific (IDA & IBRD countries)EcuadorEgypt, Arab Rep.El SalvadorEquatorial GuineaEritreaEstoniaEthiopiaEuro areaEurope & Central AsiaEurope & Central Asia (excluding high income)Europe & Central Asia (IDA & IBRD countries)European UnionFijiFinlandFragile and conflict affected situationsFranceFrench PolynesiaGabonGambia, TheGeorgiaGermanyGhanaGreeceGrenadaGuamGuatemalaGuineaGuinea-BissauGuyanaHaitiHeavily indebted poor countries (HIPC)High incomeHondurasHong Kong SAR, ChinaHungaryIBRD onlyIcelandIDA & IBRD totalIDA blendIDA onlyIDA totalIndiaIndonesiaIran, Islamic Rep.IraqIrelandIsraelItalyJamaicaJapanJordanKazakhstanKenyaKiribatiKorea, Dem. People’s Rep.Korea, Rep.KuwaitKyrgyz RepublicLao PDRLate-demographic dividendLatin America & Caribbean Latin America & Caribbean (excluding high income)Latin America & the Caribbean (IDA & IBRD countries)LatviaLeast developed countries: UN classificationLebanonLesothoLiberiaLibyaLithuaniaLow & middle incomeLow incomeLower middle incomeLuxembourgMacao SAR, ChinaMacedonia, FYRMadagascarMalawiMalaysiaMaldivesMaliMaltaMauritaniaMauritiusMexicoMicronesia, Fed. Sts.Middle East & North AfricaMiddle East & North Africa (excluding high income)Middle East & North Africa (IDA & IBRD countries)Middle incomeMoldovaMongoliaMontenegroMoroccoMozambiqueMyanmarNamibiaNepalNetherlandsNew CaledoniaNew ZealandNicaraguaNigerNigeriaNorth AmericaNorwayOECD membersOmanOther small statesPacific island small statesPakistanPanamaPapua New GuineaParaguayPeruPhilippinesPolandPortugalPost-demographic dividendPre-demographic dividendPuerto RicoQatarRomaniaRussian FederationRwandaSamoaSao Tome and PrincipeSaudi ArabiaSenegalSerbiaSeychellesSierra LeoneSingaporeSlovak RepublicSloveniaSmall statesSolomon IslandsSomaliaSouth AfricaSouth AsiaSouth Asia (IDA & IBRD)South SudanSpainSri LankaSt. LuciaSt. Vincent and the GrenadinesSub-Saharan Africa Sub-Saharan Africa (excluding high income)Sub-Saharan Africa (IDA & IBRD countries)SudanSurinameSwazilandSwedenSwitzerlandSyrian Arab RepublicTajikistanTanzaniaThailandTimor-LesteTogoTongaTrinidad and TobagoTunisiaTurkeyTurkmenistanUgandaUkraineUnited Arab EmiratesUnited KingdomUnited StatesUpper middle incomeUruguayUzbekistanVanuatuVenezuela, RBVietnamVirgin Islands (U.S.)West Bank and GazaWorldYemen, Rep.ZambiaZimbabwe Linea del tempo:
Questa scala temporale mostra un grafico dal 1961 anno al 2015 anno. Korea, Dem. People’s Rep.. I dati fino ad 1960 anno non disponibili. Il numero di osservazioni attuali secondo i date: 55.
La fonte (nome):
Indicatori dello sviluppo mondiale
La fonte (organizzazione):
United Nations Population Division. World Population Prospects. New York, United Nations, Department of Economic and Social Affairs (advanced Excel tables). Available at http://esa.un.org/wpp/unpp/panel_population.htm.
Categorie:
Health, Gender
sono stati aggiornati
23 apr 2017 anni
Indicatori delle variazioni dei valori per anni
Minima:
33.127
1 gen 1961 anni
Massimo:
68.426
1 gen 1993 anni
Alla data di osservazione
Valore
Variazione assoluta
La variazione rispetto al valore precedente
1 gen 1961 anni
33.127
+33.127
0.0%
1 gen 1962 anni
33.53
+0.403
1.22%
1 gen 1963 anni
33.933
+0.403
1.2%
1 gen 1964 anni
35.655
+1.722
5.07%
1 gen 1965 anni
37.376
+1.722
4.83%
1 gen 1966 anni
39.098
+1.722
4.61%
1 gen 1967 anni
40.82
+1.722
4.4%
1 gen 1968 anni
42.541
+1.722
4.22%
1 gen 1969 anni
44.131
+1.59
3.74%
1 gen 1970 anni
45.721
+1.59
3.6%
1 gen 1971 anni
47.311
+1.59
3.48%
1 gen 1972 anni
48.9
+1.59
3.36%
1 gen 1973 anni
50.49
+1.59
3.25%
1 gen 1974 anni
51.776
+1.286
2.55%
1 gen 1975 anni
53.063
+1.286
2.48%
1 gen 1976 anni
54.349
+1.286
2.42%
1 gen 1977 anni
55.635
+1.286
2.37%
1 gen 1978 anni
56.922
+1.286
2.31%
1 gen 1979 anni
57.751
+0.829
1.46%
1 gen 1980 anni
58.581
+0.829
1.44%
1 gen 1981 anni
59.41
+0.829
1.42%
1 gen 1982 anni
60.239
+0.829
1.4%
1 gen 1983 anni
61.069
+0.829
1.38%
1 gen 1984 anni
61.694
+0.626
1.02%
1 gen 1985 anni
62.32
+0.626
1.01%
1 gen 1986 anni
62.946
+0.626
1.0%
1 gen 1987 anni
63.572
+0.626
0.99%
1 gen 1988 anni
64.197
+0.626
0.98%
1 gen 1989 anni
65.043
+0.846
1.32%
1 gen 1990 anni
65.889
+0.846
1.3%
1 gen 1991 anni
66.734
+0.846
1.28%
1 gen 1992 anni
67.58
+0.846
1.27%
1 gen 1993 anni
68.426
+0.846
1.25%
1 gen 1994 anni
65.566
-2.86
-4.18%
1 gen 1995 anni
62.706
-2.86
-4.36%
1 gen 1996 anni
59.846
-2.86
-4.56%
1 gen 1997 anni
56.986
-2.86
-4.78%
1 gen 1998 anni
54.126
-2.86
-5.02%
1 gen 1999 anni
55.786
+1.66
3.07%
1 gen 2000 anni
57.446
+1.66
2.98%
1 gen 2001 anni
59.107
+1.66
2.89%
1 gen 2002 anni
60.767
+1.66
2.81%
1 gen 2003 anni
62.427
+1.66
2.73%
1 gen 2004 anni
62.688
+0.261
0.42%
1 gen 2005 anni
62.949
+0.261
0.42%
1 gen 2006 anni
63.21
+0.261
0.41%
1 gen 2007 anni
63.471
+0.261
0.41%
1 gen 2008 anni
63.732
+0.261
0.41%
1 gen 2009 anni
64.307
+0.575
0.9%
1 gen 2010 anni
64.881
+0.575
0.89%
1 gen 2011 anni
65.456
+0.575
0.89%
1 gen 2012 anni
66.031
+0.575
0.88%
1 gen 2013 anni
66.605
+0.575
0.87%
1 gen 2014 anni
67.12
+0.515
0.77%
1 gen 2015 anni
67.636
+0.515
0.77%
Classificazione dei paesi secondo i statistiche attuali per anni


Commenti: