29
/it/
it
AIzaSyAYiBZKx7MnpbEhh9jyipgxe19OcubqV5w
April 1, 2024
39575
IDA only
IDX
false
2
1
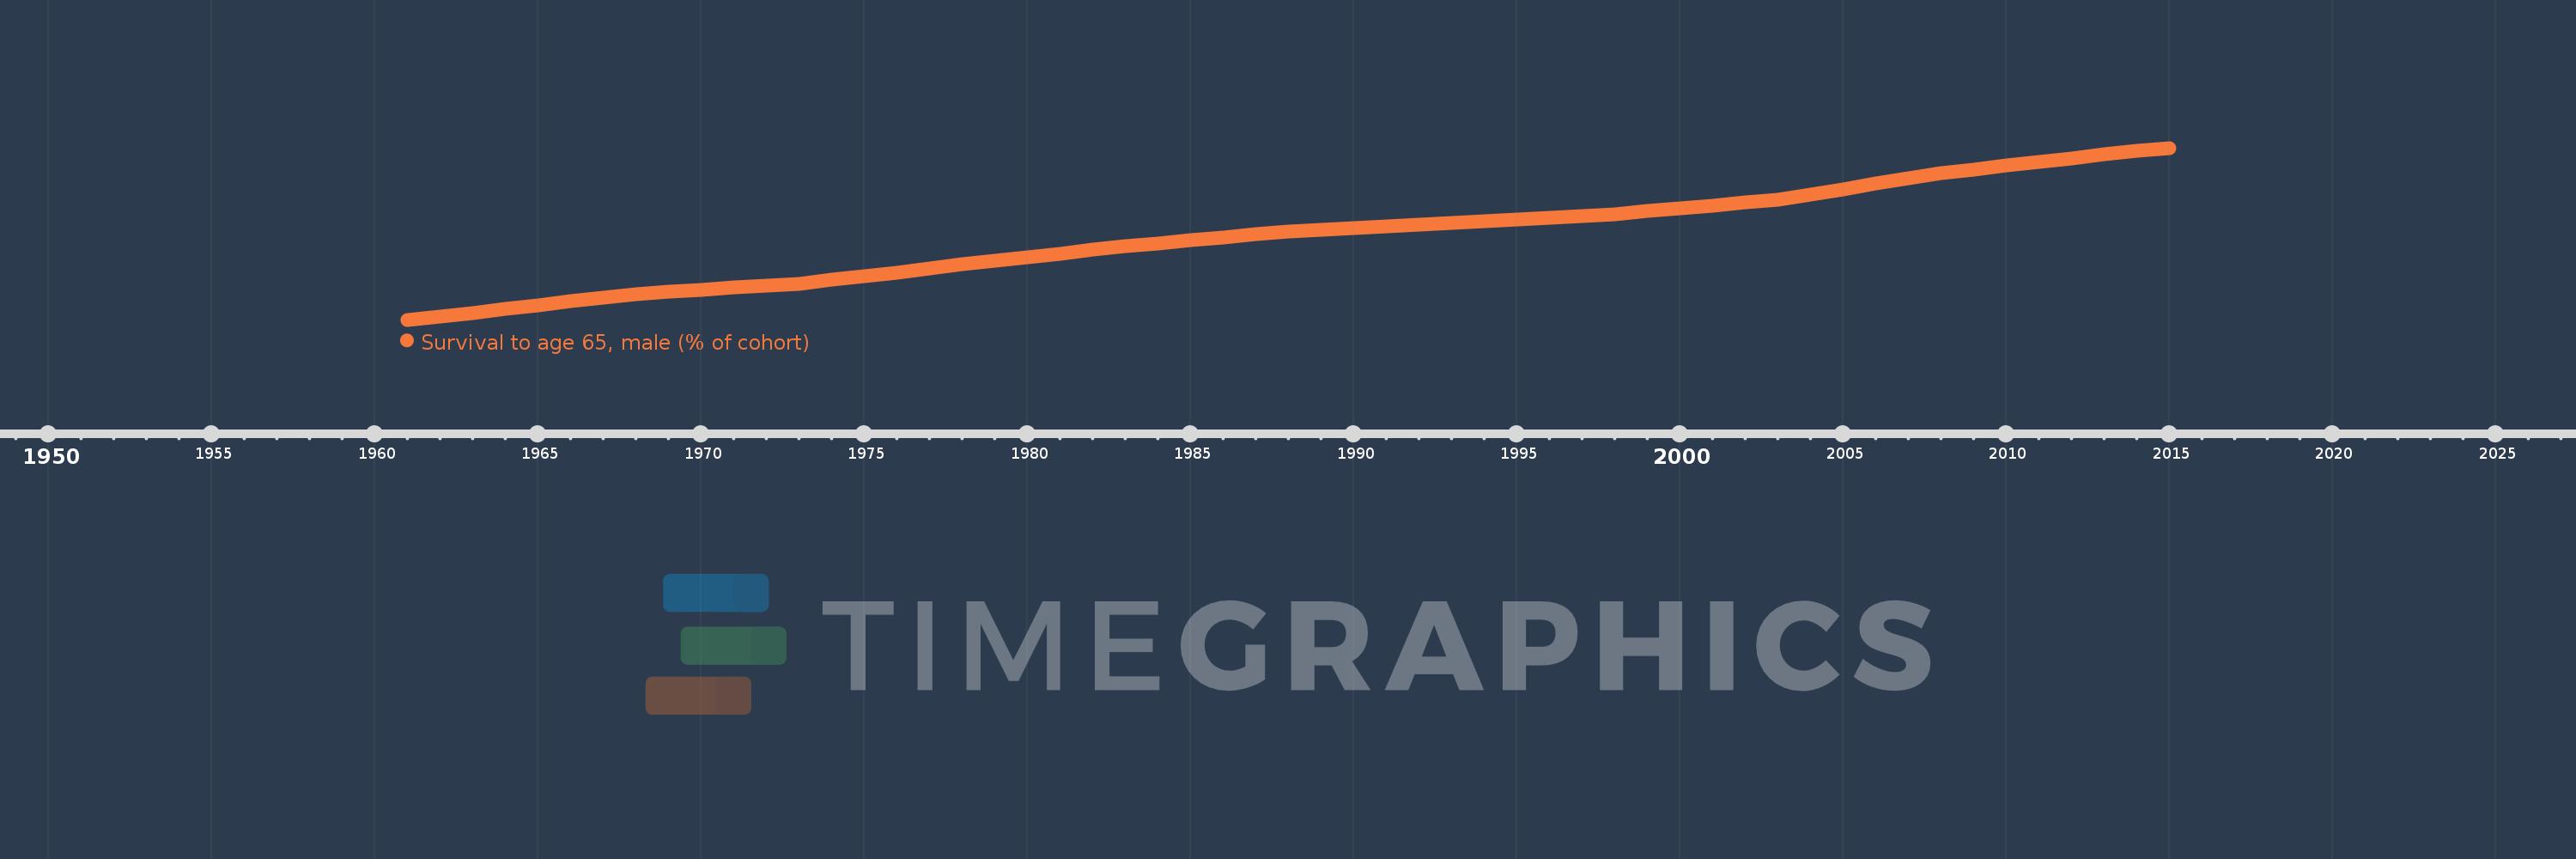
Survival to age 65, male (% of cohort)
2015,2014,2013,2012,2011,2010,2009,2008,2007,2006,2005,2004,2003,2002,2001,2000,1999,1998,1997,1996,1995,1994,1993,1992,1991,1990,1989,1988,1987,1986,1985,1984,1983,1982,1981,1980,1979,1978,1977,1976,1975,1974,1973,1972,1971,1970,1969,1968,1967,1966,1965,1964,1963,1962,1961
Queste statistiche in altri paesi:
AfghanistanAlbaniaAlgeriaAngolaAntigua and BarbudaArab WorldArgentinaArmeniaArubaAustraliaAustriaAzerbaijanBahamas, TheBahrainBangladeshBarbadosBelarusBelgiumBelizeBeninBhutanBoliviaBosnia and HerzegovinaBotswanaBrazilBrunei DarussalamBulgariaBurkina FasoBurundiCabo VerdeCambodiaCameroonCanadaCaribbean small statesCentral African RepublicCentral Europe and the BalticsChadChannel IslandsChileChinaColombiaComorosCongo, Dem. Rep.Congo, Rep.Costa RicaCote d'IvoireCroatiaCubaCuracaoCyprusCzech RepublicDenmarkDjiboutiDominican RepublicEarly-demographic dividendEast Asia & PacificEast Asia & Pacific (excluding high income)East Asia & Pacific (IDA & IBRD countries)EcuadorEgypt, Arab Rep.El SalvadorEquatorial GuineaEritreaEstoniaEthiopiaEuro areaEurope & Central AsiaEurope & Central Asia (excluding high income)Europe & Central Asia (IDA & IBRD countries)European UnionFijiFinlandFragile and conflict affected situationsFranceFrench PolynesiaGabonGambia, TheGeorgiaGermanyGhanaGreeceGrenadaGuamGuatemalaGuineaGuinea-BissauGuyanaHaitiHeavily indebted poor countries (HIPC)High incomeHondurasHong Kong SAR, ChinaHungaryIBRD onlyIcelandIDA & IBRD totalIDA blendIDA onlyIDA totalIndiaIndonesiaIran, Islamic Rep.IraqIrelandIsraelItalyJamaicaJapanJordanKazakhstanKenyaKiribatiKorea, Dem. People’s Rep.Korea, Rep.KuwaitKyrgyz RepublicLao PDRLate-demographic dividendLatin America & Caribbean Latin America & Caribbean (excluding high income)Latin America & the Caribbean (IDA & IBRD countries)LatviaLeast developed countries: UN classificationLebanonLesothoLiberiaLibyaLithuaniaLow & middle incomeLow incomeLower middle incomeLuxembourgMacao SAR, ChinaMacedonia, FYRMadagascarMalawiMalaysiaMaldivesMaliMaltaMauritaniaMauritiusMexicoMicronesia, Fed. Sts.Middle East & North AfricaMiddle East & North Africa (excluding high income)Middle East & North Africa (IDA & IBRD countries)Middle incomeMoldovaMongoliaMontenegroMoroccoMozambiqueMyanmarNamibiaNepalNetherlandsNew CaledoniaNew ZealandNicaraguaNigerNigeriaNorth AmericaNorwayOECD membersOmanOther small statesPacific island small statesPakistanPanamaPapua New GuineaParaguayPeruPhilippinesPolandPortugalPost-demographic dividendPre-demographic dividendPuerto RicoQatarRomaniaRussian FederationRwandaSamoaSao Tome and PrincipeSaudi ArabiaSenegalSerbiaSeychellesSierra LeoneSingaporeSlovak RepublicSloveniaSmall statesSolomon IslandsSomaliaSouth AfricaSouth AsiaSouth Asia (IDA & IBRD)South SudanSpainSri LankaSt. LuciaSt. Vincent and the GrenadinesSub-Saharan Africa Sub-Saharan Africa (excluding high income)Sub-Saharan Africa (IDA & IBRD countries)SudanSurinameSwazilandSwedenSwitzerlandSyrian Arab RepublicTajikistanTanzaniaThailandTimor-LesteTogoTongaTrinidad and TobagoTunisiaTurkeyTurkmenistanUgandaUkraineUnited Arab EmiratesUnited KingdomUnited StatesUpper middle incomeUruguayUzbekistanVanuatuVenezuela, RBVietnamVirgin Islands (U.S.)West Bank and GazaWorldYemen, Rep.ZambiaZimbabwe Linea del tempo:
Questa scala temporale mostra un grafico dal 1961 anno al 2015 anno. IDA only. I dati fino ad 1960 anno non disponibili. Il numero di osservazioni attuali secondo i date: 55.
La fonte (nome):
Indicatori dello sviluppo mondiale
La fonte (organizzazione):
United Nations Population Division. World Population Prospects. New York, United Nations, Department of Economic and Social Affairs (advanced Excel tables). Available at http://esa.un.org/wpp/unpp/panel_population.htm.
Categorie:
Health, Gender
sono stati aggiornati
23 apr 2017 anni
Indicatori delle variazioni dei valori per anni
Minima:
30.491
1 gen 1961 anni
Massimo:
60.277
1 gen 2015 anni
Alla data di osservazione
Valore
Variazione assoluta
La variazione rispetto al valore precedente
1 gen 1961 anni
30.491
+30.491
0.0%
1 gen 1962 anni
31.1
+0.609
2.0%
1 gen 1963 anni
31.711
+0.611
1.96%
1 gen 1964 anni
32.367
+0.656
2.07%
1 gen 1965 anni
33.019
+0.652
2.01%
1 gen 1966 anni
33.667
+0.648
1.96%
1 gen 1967 anni
34.325
+0.658
1.95%
1 gen 1968 anni
34.979
+0.654
1.91%
1 gen 1969 anni
35.34
+0.361
1.03%
1 gen 1970 anni
35.696
+0.356
1.01%
1 gen 1971 anni
36.05
+0.353
0.99%
1 gen 1972 anni
36.406
+0.356
0.99%
1 gen 1973 anni
36.758
+0.352
0.97%
1 gen 1974 anni
37.397
+0.64
1.74%
1 gen 1975 anni
38.038
+0.641
1.71%
1 gen 1976 anni
38.687
+0.649
1.71%
1 gen 1977 anni
39.362
+0.675
1.74%
1 gen 1978 anni
40.057
+0.696
1.77%
1 gen 1979 anni
40.707
+0.649
1.62%
1 gen 1980 anni
41.348
+0.641
1.58%
1 gen 1981 anni
41.979
+0.631
1.53%
1 gen 1982 anni
42.605
+0.626
1.49%
1 gen 1983 anni
43.229
+0.624
1.46%
1 gen 1984 anni
43.756
+0.527
1.22%
1 gen 1985 anni
44.274
+0.519
1.19%
1 gen 1986 anni
44.784
+0.51
1.15%
1 gen 1987 anni
45.298
+0.513
1.15%
1 gen 1988 anni
45.799
+0.502
1.11%
1 gen 1989 anni
46.077
+0.278
0.61%
1 gen 1990 anni
46.35
+0.272
0.59%
1 gen 1991 anni
46.621
+0.271
0.59%
1 gen 1992 anni
46.909
+0.287
0.62%
1 gen 1993 anni
47.205
+0.296
0.63%
1 gen 1994 anni
47.545
+0.34
0.72%
1 gen 1995 anni
47.868
+0.323
0.68%
1 gen 1996 anni
48.177
+0.308
0.64%
1 gen 1997 anni
48.483
+0.307
0.64%
1 gen 1998 anni
48.78
+0.296
0.61%
1 gen 1999 anni
49.298
+0.518
1.06%
1 gen 2000 anni
49.81
+0.512
1.04%
1 gen 2001 anni
50.316
+0.507
1.02%
1 gen 2002 anni
50.821
+0.505
1.0%
1 gen 2003 anni
51.319
+0.499
0.98%
1 gen 2004 anni
52.234
+0.915
1.78%
1 gen 2005 anni
53.146
+0.912
1.75%
1 gen 2006 anni
54.056
+0.91
1.71%
1 gen 2007 anni
54.971
+0.915
1.69%
1 gen 2008 anni
55.884
+0.914
1.66%
1 gen 2009 anni
56.537
+0.652
1.17%
1 gen 2010 anni
57.185
+0.648
1.15%
1 gen 2011 anni
57.833
+0.648
1.13%
1 gen 2012 anni
58.49
+0.657
1.14%
1 gen 2013 anni
59.155
+0.665
1.14%
1 gen 2014 anni
59.715
+0.56
0.95%
1 gen 2015 anni
60.277
+0.562
0.94%
Classificazione dei paesi secondo i statistiche attuali per anni


Commenti: