29
/it/
it
AIzaSyAYiBZKx7MnpbEhh9jyipgxe19OcubqV5w
April 1, 2024
52379
OECD members
OED
false
2
1
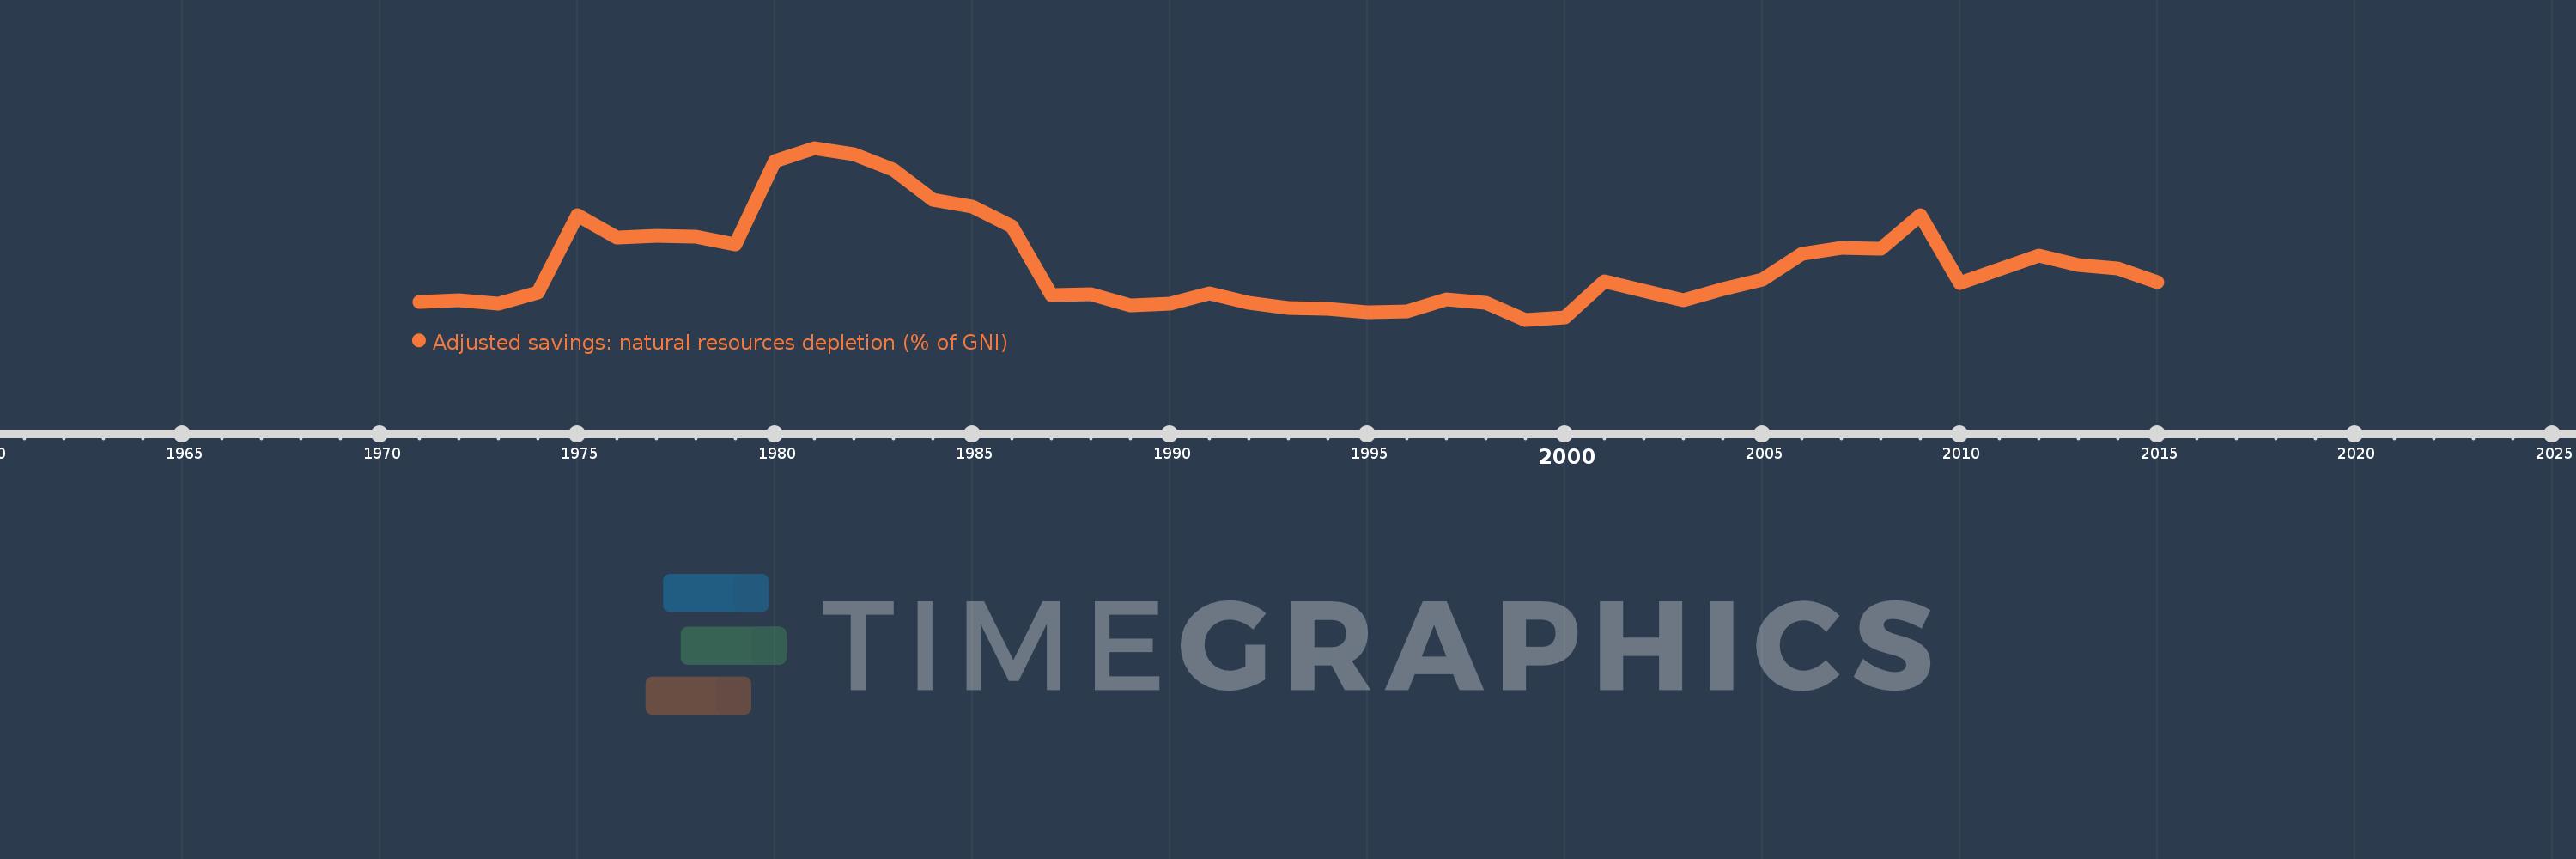
Adjusted savings: natural resources depletion (% of GNI)
2015,2014,2013,2012,2011,2010,2009,2008,2007,2006,2005,2004,2003,2002,2001,2000,1999,1998,1997,1996,1995,1994,1993,1992,1991,1990,1989,1988,1987,1986,1985,1984,1983,1982,1981,1980,1979,1978,1977,1976,1975,1974,1973,1972,1971
Queste statistiche in altri paesi:
AfghanistanAlbaniaAlgeriaAngolaArab WorldArgentinaArmeniaAustraliaAustriaAzerbaijanBahamas, TheBahrainBangladeshBarbadosBelarusBelgiumBelizeBeninBhutanBoliviaBotswanaBrazilBrunei DarussalamBulgariaBurkina FasoBurundiCabo VerdeCambodiaCameroonCanadaCaribbean small statesCentral African RepublicCentral Europe and the BalticsChadChileChinaColombiaComorosCongo, Dem. Rep.Congo, Rep.Costa RicaCote d'IvoireCroatiaCubaCyprusCzech RepublicDenmarkDjiboutiDominicaDominican RepublicEarly-demographic dividendEast Asia & PacificEast Asia & Pacific (excluding high income)East Asia & Pacific (IDA & IBRD countries)EcuadorEgypt, Arab Rep.El SalvadorEquatorial GuineaEritreaEstoniaEthiopiaEuro areaEurope & Central AsiaEurope & Central Asia (excluding high income)Europe & Central Asia (IDA & IBRD countries)European UnionFijiFinlandFragile and conflict affected situationsFranceFrench PolynesiaGabonGambia, TheGeorgiaGermanyGhanaGreeceGuatemalaGuineaGuinea-BissauGuyanaHaitiHeavily indebted poor countries (HIPC)High incomeHondurasHong Kong SAR, ChinaHungaryIBRD onlyIcelandIDA & IBRD totalIDA blendIDA onlyIDA totalIndiaIndonesiaIran, Islamic Rep.IraqIrelandIsraelItalyJamaicaJapanJordanKazakhstanKenyaKiribatiKorea, Rep.KuwaitKyrgyz RepublicLao PDRLate-demographic dividendLatin America & Caribbean Latin America & Caribbean (excluding high income)Latin America & the Caribbean (IDA & IBRD countries)LatviaLeast developed countries: UN classificationLebanonLesothoLiberiaLibyaLithuaniaLow & middle incomeLow incomeLower middle incomeLuxembourgMacedonia, FYRMadagascarMalawiMalaysiaMaldivesMaliMauritaniaMauritiusMexicoMicronesia, Fed. Sts.Middle East & North AfricaMiddle East & North Africa (excluding high income)Middle East & North Africa (IDA & IBRD countries)Middle incomeMoldovaMongoliaMoroccoMozambiqueMyanmarNamibiaNepalNetherlandsNew CaledoniaNew ZealandNicaraguaNigerNigeriaNorth AmericaNorwayOECD membersOmanOther small statesPacific island small statesPakistanPanamaPapua New GuineaParaguayPeruPhilippinesPolandPortugalPost-demographic dividendPre-demographic dividendQatarRomaniaRussian FederationRwandaSamoaSao Tome and PrincipeSaudi ArabiaSenegalSeychellesSierra LeoneSingaporeSlovak RepublicSloveniaSmall statesSolomon IslandsSomaliaSouth AfricaSouth AsiaSouth Asia (IDA & IBRD)SpainSri LankaSt. LuciaSt. Vincent and the GrenadinesSub-Saharan Africa Sub-Saharan Africa (excluding high income)Sub-Saharan Africa (IDA & IBRD countries)SudanSurinameSwazilandSwedenSwitzerlandSyrian Arab RepublicTajikistanTanzaniaThailandTogoTongaTrinidad and TobagoTunisiaTurkeyTurkmenistanUgandaUkraineUnited Arab EmiratesUnited KingdomUnited StatesUpper middle incomeUruguayUzbekistanVanuatuVenezuela, RBVietnamWorldYemen, Rep.ZambiaZimbabwe Linea del tempo:
Questa scala temporale mostra un grafico dal 1971 anno al 2015 anno. OECD members. I dati fino ad 1970 anno non disponibili. Il numero di osservazioni attuali secondo i date: 45.
La fonte (nome):
Indicatori dello sviluppo mondiale
La fonte (organizzazione):
World Bank staff estimates based on sources and methods in World Bank's "The Changing Wealth of Nations: Measuring Sustainable Development in the New Millennium" (2011).
Categorie:
Economy & Growth, Energy & Mining
sono stati aggiornati
23 apr 2017 anni
Indicatori delle variazioni dei valori per anni
Minima:
0.286
1 gen 1999 anni
Massimo:
2.415
1 gen 1981 anni
Alla data di osservazione
Valore
Variazione assoluta
La variazione rispetto al valore precedente
1 gen 1971 anni
0.508
+0.508
0.0%
1 gen 1972 anni
0.524
+0.017
3.26%
1 gen 1973 anni
0.48
-0.044
-8.41%
1 gen 1974 anni
0.627
+0.147
30.63%
1 gen 1975 anni
1.58
+0.952
151.79%
1 gen 1976 anni
1.301
-0.279
-17.67%
1 gen 1977 anni
1.325
+0.025
1.91%
1 gen 1978 anni
1.311
-0.014
-1.09%
1 gen 1979 anni
1.215
-0.096
-7.35%
1 gen 1980 anni
2.257
+1.042
85.8%
1 gen 1981 anni
2.415
+0.158
7.0%
1 gen 1982 anni
2.336
-0.079
-3.28%
1 gen 1983 anni
2.144
-0.192
-8.2%
1 gen 1984 anni
1.771
-0.373
-17.41%
1 gen 1985 anni
1.683
-0.088
-4.95%
1 gen 1986 anni
1.444
-0.239
-14.23%
1 gen 1987 anni
0.59
-0.853
-59.11%
1 gen 1988 anni
0.597
+0.007
1.13%
1 gen 1989 anni
0.459
-0.138
-23.15%
1 gen 1990 anni
0.483
+0.024
5.28%
1 gen 1991 anni
0.615
+0.132
27.31%
1 gen 1992 anni
0.496
-0.119
-19.28%
1 gen 1993 anni
0.429
-0.068
-13.65%
1 gen 1994 anni
0.416
-0.013
-3.05%
1 gen 1995 anni
0.382
-0.033
-7.99%
1 gen 1996 anni
0.392
+0.01
2.52%
1 gen 1997 anni
0.534
+0.142
36.23%
1 gen 1998 anni
0.496
-0.038
-7.07%
1 gen 1999 anni
0.286
-0.21
-42.28%
1 gen 2000 anni
0.311
+0.024
8.47%
1 gen 2001 anni
0.758
+0.448
144.06%
1 gen 2002 anni
0.644
-0.115
-15.11%
1 gen 2003 anni
0.529
-0.114
-17.77%
1 gen 2004 anni
0.667
+0.138
26.08%
1 gen 2005 anni
0.78
+0.112
16.82%
1 gen 2006 anni
1.102
+0.323
41.41%
1 gen 2007 anni
1.178
+0.076
6.88%
1 gen 2008 anni
1.171
-0.007
-0.59%
1 gen 2009 anni
1.577
+0.406
34.69%
1 gen 2010 anni
0.744
-0.834
-52.86%
1 gen 2011 anni
0.913
+0.169
22.78%
1 gen 2012 anni
1.082
+0.169
18.55%
1 gen 2013 anni
0.968
-0.114
-10.53%
1 gen 2014 anni
0.923
-0.045
-4.67%
1 gen 2015 anni
0.755
-0.168
-18.19%
Classificazione dei paesi secondo i statistiche attuali per anni


Commenti: