29
/it/
it
AIzaSyAYiBZKx7MnpbEhh9jyipgxe19OcubqV5w
April 1, 2024
33202
European Union
EUU
false
2
1
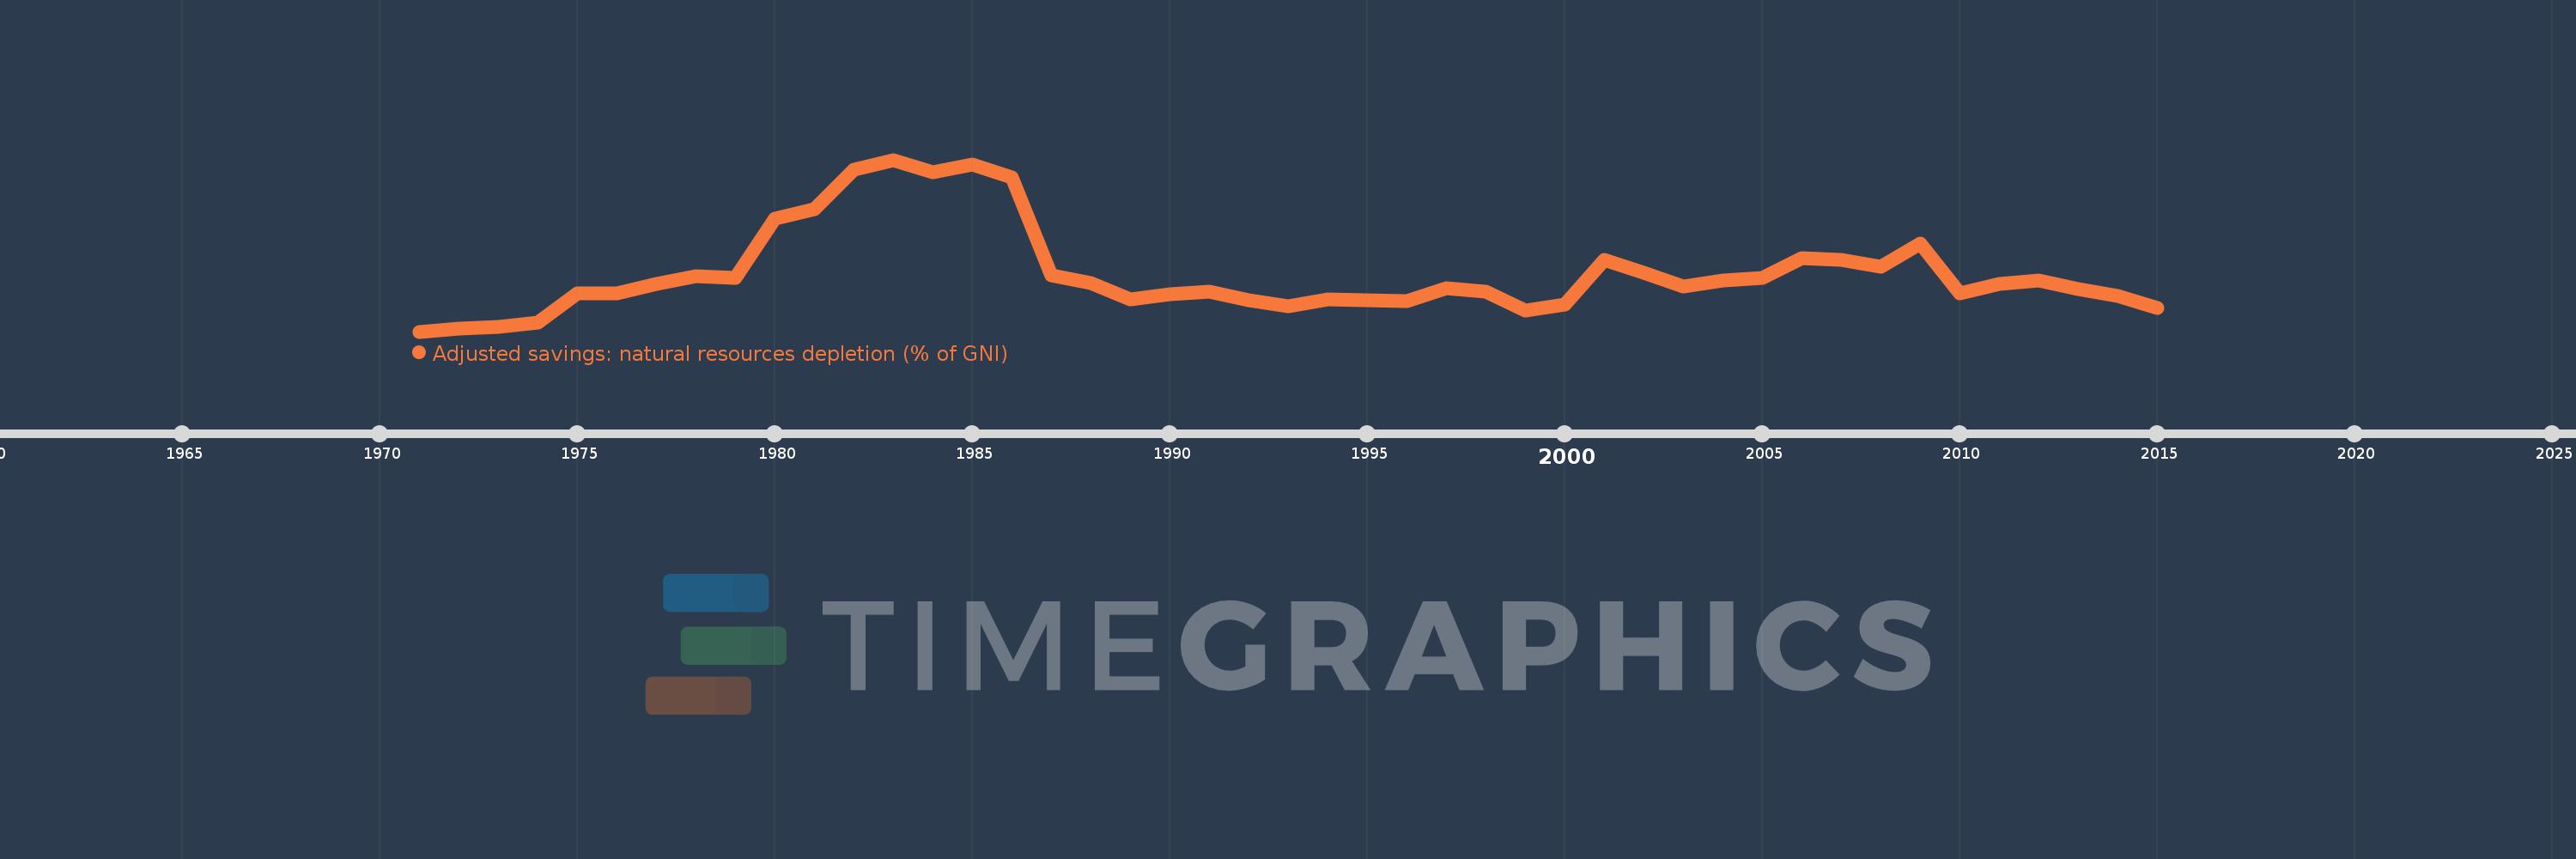
Adjusted savings: natural resources depletion (% of GNI)
2015,2014,2013,2012,2011,2010,2009,2008,2007,2006,2005,2004,2003,2002,2001,2000,1999,1998,1997,1996,1995,1994,1993,1992,1991,1990,1989,1988,1987,1986,1985,1984,1983,1982,1981,1980,1979,1978,1977,1976,1975,1974,1973,1972,1971
Queste statistiche in altri paesi:
AfghanistanAlbaniaAlgeriaAngolaArab WorldArgentinaArmeniaAustraliaAustriaAzerbaijanBahamas, TheBahrainBangladeshBarbadosBelarusBelgiumBelizeBeninBhutanBoliviaBotswanaBrazilBrunei DarussalamBulgariaBurkina FasoBurundiCabo VerdeCambodiaCameroonCanadaCaribbean small statesCentral African RepublicCentral Europe and the BalticsChadChileChinaColombiaComorosCongo, Dem. Rep.Congo, Rep.Costa RicaCote d'IvoireCroatiaCubaCyprusCzech RepublicDenmarkDjiboutiDominicaDominican RepublicEarly-demographic dividendEast Asia & PacificEast Asia & Pacific (excluding high income)East Asia & Pacific (IDA & IBRD countries)EcuadorEgypt, Arab Rep.El SalvadorEquatorial GuineaEritreaEstoniaEthiopiaEuro areaEurope & Central AsiaEurope & Central Asia (excluding high income)Europe & Central Asia (IDA & IBRD countries)European UnionFijiFinlandFragile and conflict affected situationsFranceFrench PolynesiaGabonGambia, TheGeorgiaGermanyGhanaGreeceGuatemalaGuineaGuinea-BissauGuyanaHaitiHeavily indebted poor countries (HIPC)High incomeHondurasHong Kong SAR, ChinaHungaryIBRD onlyIcelandIDA & IBRD totalIDA blendIDA onlyIDA totalIndiaIndonesiaIran, Islamic Rep.IraqIrelandIsraelItalyJamaicaJapanJordanKazakhstanKenyaKiribatiKorea, Rep.KuwaitKyrgyz RepublicLao PDRLate-demographic dividendLatin America & Caribbean Latin America & Caribbean (excluding high income)Latin America & the Caribbean (IDA & IBRD countries)LatviaLeast developed countries: UN classificationLebanonLesothoLiberiaLibyaLithuaniaLow & middle incomeLow incomeLower middle incomeLuxembourgMacedonia, FYRMadagascarMalawiMalaysiaMaldivesMaliMauritaniaMauritiusMexicoMicronesia, Fed. Sts.Middle East & North AfricaMiddle East & North Africa (excluding high income)Middle East & North Africa (IDA & IBRD countries)Middle incomeMoldovaMongoliaMoroccoMozambiqueMyanmarNamibiaNepalNetherlandsNew CaledoniaNew ZealandNicaraguaNigerNigeriaNorth AmericaNorwayOECD membersOmanOther small statesPacific island small statesPakistanPanamaPapua New GuineaParaguayPeruPhilippinesPolandPortugalPost-demographic dividendPre-demographic dividendQatarRomaniaRussian FederationRwandaSamoaSao Tome and PrincipeSaudi ArabiaSenegalSeychellesSierra LeoneSingaporeSlovak RepublicSloveniaSmall statesSolomon IslandsSomaliaSouth AfricaSouth AsiaSouth Asia (IDA & IBRD)SpainSri LankaSt. LuciaSt. Vincent and the GrenadinesSub-Saharan Africa Sub-Saharan Africa (excluding high income)Sub-Saharan Africa (IDA & IBRD countries)SudanSurinameSwazilandSwedenSwitzerlandSyrian Arab RepublicTajikistanTanzaniaThailandTogoTongaTrinidad and TobagoTunisiaTurkeyTurkmenistanUgandaUkraineUnited Arab EmiratesUnited KingdomUnited StatesUpper middle incomeUruguayUzbekistanVanuatuVenezuela, RBVietnamWorldYemen, Rep.ZambiaZimbabwe Linea del tempo:
Questa scala temporale mostra un grafico dal 1971 anno al 2015 anno. European Union. I dati fino ad 1970 anno non disponibili. Il numero di osservazioni attuali secondo i date: 45.
La fonte (nome):
Indicatori dello sviluppo mondiale
La fonte (organizzazione):
World Bank staff estimates based on sources and methods in World Bank's "The Changing Wealth of Nations: Measuring Sustainable Development in the New Millennium" (2011).
Categorie:
Economy & Growth, Energy & Mining
sono stati aggiornati
23 apr 2017 anni
Indicatori delle variazioni dei valori per anni
Minima:
0.068
1 gen 1971 anni
Massimo:
1.175
1 gen 1983 anni
Alla data di osservazione
Valore
Variazione assoluta
La variazione rispetto al valore precedente
1 gen 1971 anni
0.068
+0.068
0.0%
1 gen 1972 anni
0.088
+0.02
29.96%
1 gen 1973 anni
0.098
+0.01
10.78%
1 gen 1974 anni
0.128
+0.031
31.29%
1 gen 1975 anni
0.315
+0.187
145.48%
1 gen 1976 anni
0.316
+0.001
0.32%
1 gen 1977 anni
0.375
+0.059
18.61%
1 gen 1978 anni
0.427
+0.052
13.87%
1 gen 1979 anni
0.416
-0.011
-2.58%
1 gen 1980 anni
0.795
+0.379
91.14%
1 gen 1981 anni
0.857
+0.062
7.77%
1 gen 1982 anni
1.113
+0.256
29.9%
1 gen 1983 anni
1.175
+0.063
5.62%
1 gen 1984 anni
1.092
-0.083
-7.07%
1 gen 1985 anni
1.143
+0.051
4.67%
1 gen 1986 anni
1.062
-0.082
-7.13%
1 gen 1987 anni
0.428
-0.633
-59.64%
1 gen 1988 anni
0.381
-0.047
-10.97%
1 gen 1989 anni
0.277
-0.104
-27.34%
1 gen 1990 anni
0.309
+0.032
11.57%
1 gen 1991 anni
0.327
+0.018
5.73%
1 gen 1992 anni
0.272
-0.054
-16.66%
1 gen 1993 anni
0.234
-0.038
-14.04%
1 gen 1994 anni
0.275
+0.041
17.32%
1 gen 1995 anni
0.269
-0.005
-1.98%
1 gen 1996 anni
0.262
-0.007
-2.65%
1 gen 1997 anni
0.346
+0.084
31.99%
1 gen 1998 anni
0.324
-0.022
-6.34%
1 gen 1999 anni
0.205
-0.119
-36.77%
1 gen 2000 anni
0.245
+0.04
19.33%
1 gen 2001 anni
0.532
+0.287
117.54%
1 gen 2002 anni
0.446
-0.086
-16.25%
1 gen 2003 anni
0.357
-0.089
-19.87%
1 gen 2004 anni
0.397
+0.04
11.14%
1 gen 2005 anni
0.414
+0.017
4.38%
1 gen 2006 anni
0.543
+0.129
31.24%
1 gen 2007 anni
0.532
-0.011
-2.03%
1 gen 2008 anni
0.484
-0.048
-9.07%
1 gen 2009 anni
0.638
+0.154
31.8%
1 gen 2010 anni
0.316
-0.322
-50.5%
1 gen 2011 anni
0.377
+0.061
19.38%
1 gen 2012 anni
0.397
+0.02
5.2%
1 gen 2013 anni
0.341
-0.056
-14.09%
1 gen 2014 anni
0.298
-0.043
-12.56%
1 gen 2015 anni
0.221
-0.077
-25.78%
Classificazione dei paesi secondo i statistiche attuali per anni


Commenti: