29
/it/
it
AIzaSyAYiBZKx7MnpbEhh9jyipgxe19OcubqV5w
April 1, 2024
143949
Guatemala
GTM
true
2
1
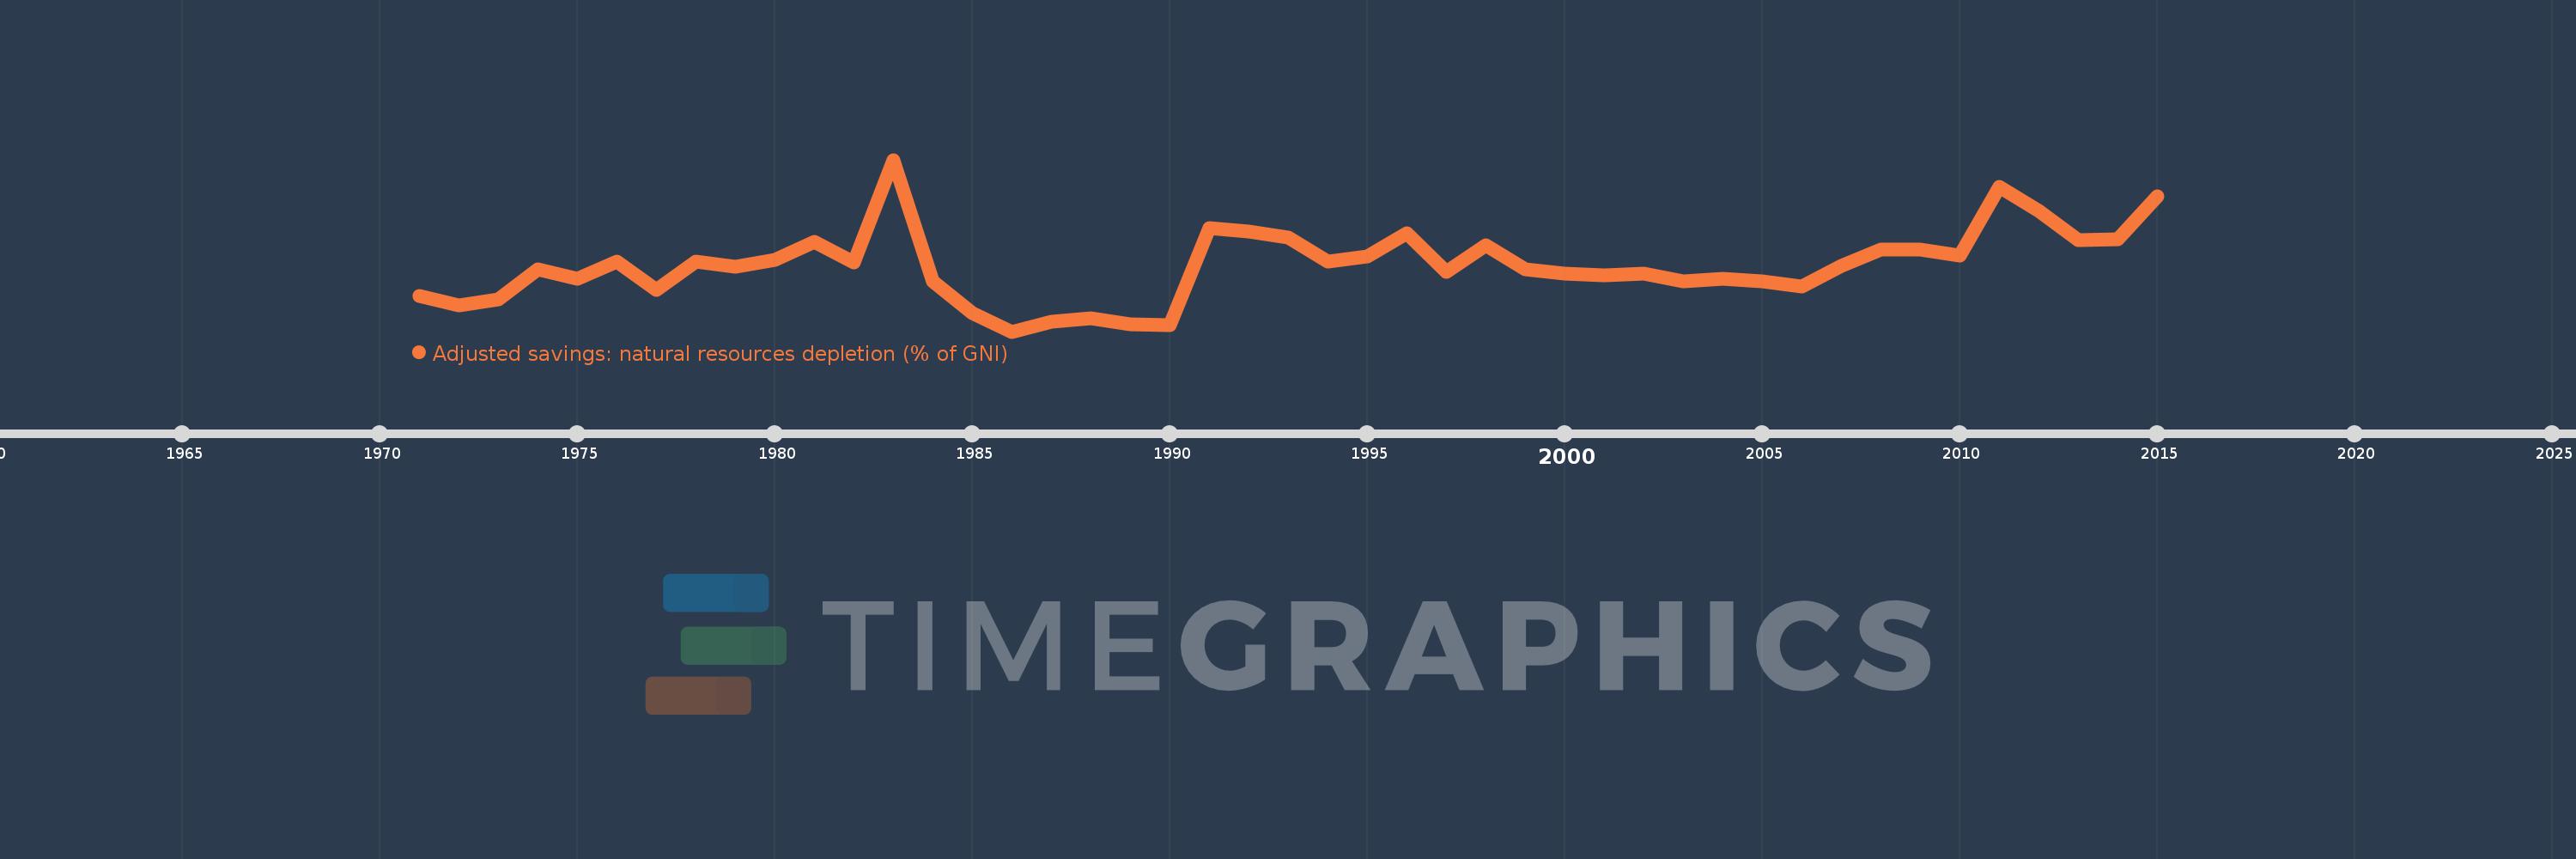
Adjusted savings: natural resources depletion (% of GNI)
2015,2014,2013,2012,2011,2010,2009,2008,2007,2006,2005,2004,2003,2002,2001,2000,1999,1998,1997,1996,1995,1994,1993,1992,1991,1990,1989,1988,1987,1986,1985,1984,1983,1982,1981,1980,1979,1978,1977,1976,1975,1974,1973,1972,1971
Queste statistiche in altri paesi:
AfghanistanAlbaniaAlgeriaAngolaArab WorldArgentinaArmeniaAustraliaAustriaAzerbaijanBahamas, TheBahrainBangladeshBarbadosBelarusBelgiumBelizeBeninBhutanBoliviaBotswanaBrazilBrunei DarussalamBulgariaBurkina FasoBurundiCabo VerdeCambodiaCameroonCanadaCaribbean small statesCentral African RepublicCentral Europe and the BalticsChadChileChinaColombiaComorosCongo, Dem. Rep.Congo, Rep.Costa RicaCote d'IvoireCroatiaCubaCyprusCzech RepublicDenmarkDjiboutiDominicaDominican RepublicEarly-demographic dividendEast Asia & PacificEast Asia & Pacific (excluding high income)East Asia & Pacific (IDA & IBRD countries)EcuadorEgypt, Arab Rep.El SalvadorEquatorial GuineaEritreaEstoniaEthiopiaEuro areaEurope & Central AsiaEurope & Central Asia (excluding high income)Europe & Central Asia (IDA & IBRD countries)European UnionFijiFinlandFragile and conflict affected situationsFranceFrench PolynesiaGabonGambia, TheGeorgiaGermanyGhanaGreeceGuatemalaGuineaGuinea-BissauGuyanaHaitiHeavily indebted poor countries (HIPC)High incomeHondurasHong Kong SAR, ChinaHungaryIBRD onlyIcelandIDA & IBRD totalIDA blendIDA onlyIDA totalIndiaIndonesiaIran, Islamic Rep.IraqIrelandIsraelItalyJamaicaJapanJordanKazakhstanKenyaKiribatiKorea, Rep.KuwaitKyrgyz RepublicLao PDRLate-demographic dividendLatin America & Caribbean Latin America & Caribbean (excluding high income)Latin America & the Caribbean (IDA & IBRD countries)LatviaLeast developed countries: UN classificationLebanonLesothoLiberiaLibyaLithuaniaLow & middle incomeLow incomeLower middle incomeLuxembourgMacedonia, FYRMadagascarMalawiMalaysiaMaldivesMaliMauritaniaMauritiusMexicoMicronesia, Fed. Sts.Middle East & North AfricaMiddle East & North Africa (excluding high income)Middle East & North Africa (IDA & IBRD countries)Middle incomeMoldovaMongoliaMoroccoMozambiqueMyanmarNamibiaNepalNetherlandsNew CaledoniaNew ZealandNicaraguaNigerNigeriaNorth AmericaNorwayOECD membersOmanOther small statesPacific island small statesPakistanPanamaPapua New GuineaParaguayPeruPhilippinesPolandPortugalPost-demographic dividendPre-demographic dividendQatarRomaniaRussian FederationRwandaSamoaSao Tome and PrincipeSaudi ArabiaSenegalSeychellesSierra LeoneSingaporeSlovak RepublicSloveniaSmall statesSolomon IslandsSomaliaSouth AfricaSouth AsiaSouth Asia (IDA & IBRD)SpainSri LankaSt. LuciaSt. Vincent and the GrenadinesSub-Saharan Africa Sub-Saharan Africa (excluding high income)Sub-Saharan Africa (IDA & IBRD countries)SudanSurinameSwazilandSwedenSwitzerlandSyrian Arab RepublicTajikistanTanzaniaThailandTogoTongaTrinidad and TobagoTunisiaTurkeyTurkmenistanUgandaUkraineUnited Arab EmiratesUnited KingdomUnited StatesUpper middle incomeUruguayUzbekistanVanuatuVenezuela, RBVietnamWorldYemen, Rep.ZambiaZimbabwe Linea del tempo:
Questa scala temporale mostra un grafico dal 1971 anno al 2015 anno. Guatemala. I dati fino ad 1970 anno non disponibili. Il numero di osservazioni attuali secondo i date: 45.
La fonte (nome):
Indicatori dello sviluppo mondiale
La fonte (organizzazione):
World Bank staff estimates based on sources and methods in World Bank's "The Changing Wealth of Nations: Measuring Sustainable Development in the New Millennium" (2011).
Categorie:
Economy & Growth, Energy & Mining
sono stati aggiornati
23 apr 2017 anni
Indicatori delle variazioni dei valori per anni
Minima:
0.747
1 gen 1986 anni
Massimo:
5.641
1 gen 1983 anni
Alla data di osservazione
Valore
Variazione assoluta
La variazione rispetto al valore precedente
1 gen 1971 anni
1.77
+1.77
0.0%
1 gen 1972 anni
1.49
-0.28
-15.83%
1 gen 1973 anni
1.672
+0.182
12.24%
1 gen 1974 anni
2.517
+0.845
50.5%
1 gen 1975 anni
2.246
-0.271
-10.77%
1 gen 1976 anni
2.737
+0.491
21.85%
1 gen 1977 anni
1.939
-0.798
-29.15%
1 gen 1978 anni
2.745
+0.806
41.59%
1 gen 1979 anni
2.584
-0.161
-5.87%
1 gen 1980 anni
2.796
+0.212
8.21%
1 gen 1981 anni
3.312
+0.516
18.44%
1 gen 1982 anni
2.717
-0.596
-17.98%
1 gen 1983 anni
5.641
+2.924
107.63%
1 gen 1984 anni
2.184
-3.457
-61.28%
1 gen 1985 anni
1.271
-0.913
-41.8%
1 gen 1986 anni
0.747
-0.524
-41.26%
1 gen 1987 anni
1.037
+0.291
38.93%
1 gen 1988 anni
1.119
+0.082
7.89%
1 gen 1989 anni
0.965
-0.154
-13.77%
1 gen 1990 anni
0.923
-0.042
-4.38%
1 gen 1991 anni
3.687
+2.765
299.59%
1 gen 1992 anni
3.602
-0.086
-2.33%
1 gen 1993 anni
3.419
-0.183
-5.08%
1 gen 1994 anni
2.734
-0.684
-20.02%
1 gen 1995 anni
2.891
+0.157
5.74%
1 gen 1996 anni
3.554
+0.663
22.91%
1 gen 1997 anni
2.438
-1.115
-31.39%
1 gen 1998 anni
3.217
+0.778
31.91%
1 gen 1999 anni
2.531
-0.685
-21.31%
1 gen 2000 anni
2.392
-0.139
-5.51%
1 gen 2001 anni
2.362
-0.03
-1.24%
1 gen 2002 anni
2.395
+0.033
1.39%
1 gen 2003 anni
2.18
-0.215
-8.99%
1 gen 2004 anni
2.243
+0.063
2.88%
1 gen 2005 anni
2.181
-0.061
-2.73%
1 gen 2006 anni
2.033
-0.148
-6.78%
1 gen 2007 anni
2.618
+0.585
28.78%
1 gen 2008 anni
3.086
+0.468
17.86%
1 gen 2009 anni
3.074
-0.012
-0.38%
1 gen 2010 anni
2.908
-0.166
-5.4%
1 gen 2011 anni
4.877
+1.968
67.68%
1 gen 2012 anni
4.174
-0.703
-14.41%
1 gen 2013 anni
3.358
-0.816
-19.56%
1 gen 2014 anni
3.369
+0.012
0.35%
1 gen 2015 anni
4.598
+1.229
36.46%
Classificazione dei paesi secondo i statistiche attuali per anni


Commenti: