29
/it/
it
AIzaSyAYiBZKx7MnpbEhh9jyipgxe19OcubqV5w
April 1, 2024
43169
Latin America & the Caribbean (IDA & IBRD countries)
TLA
false
2
1
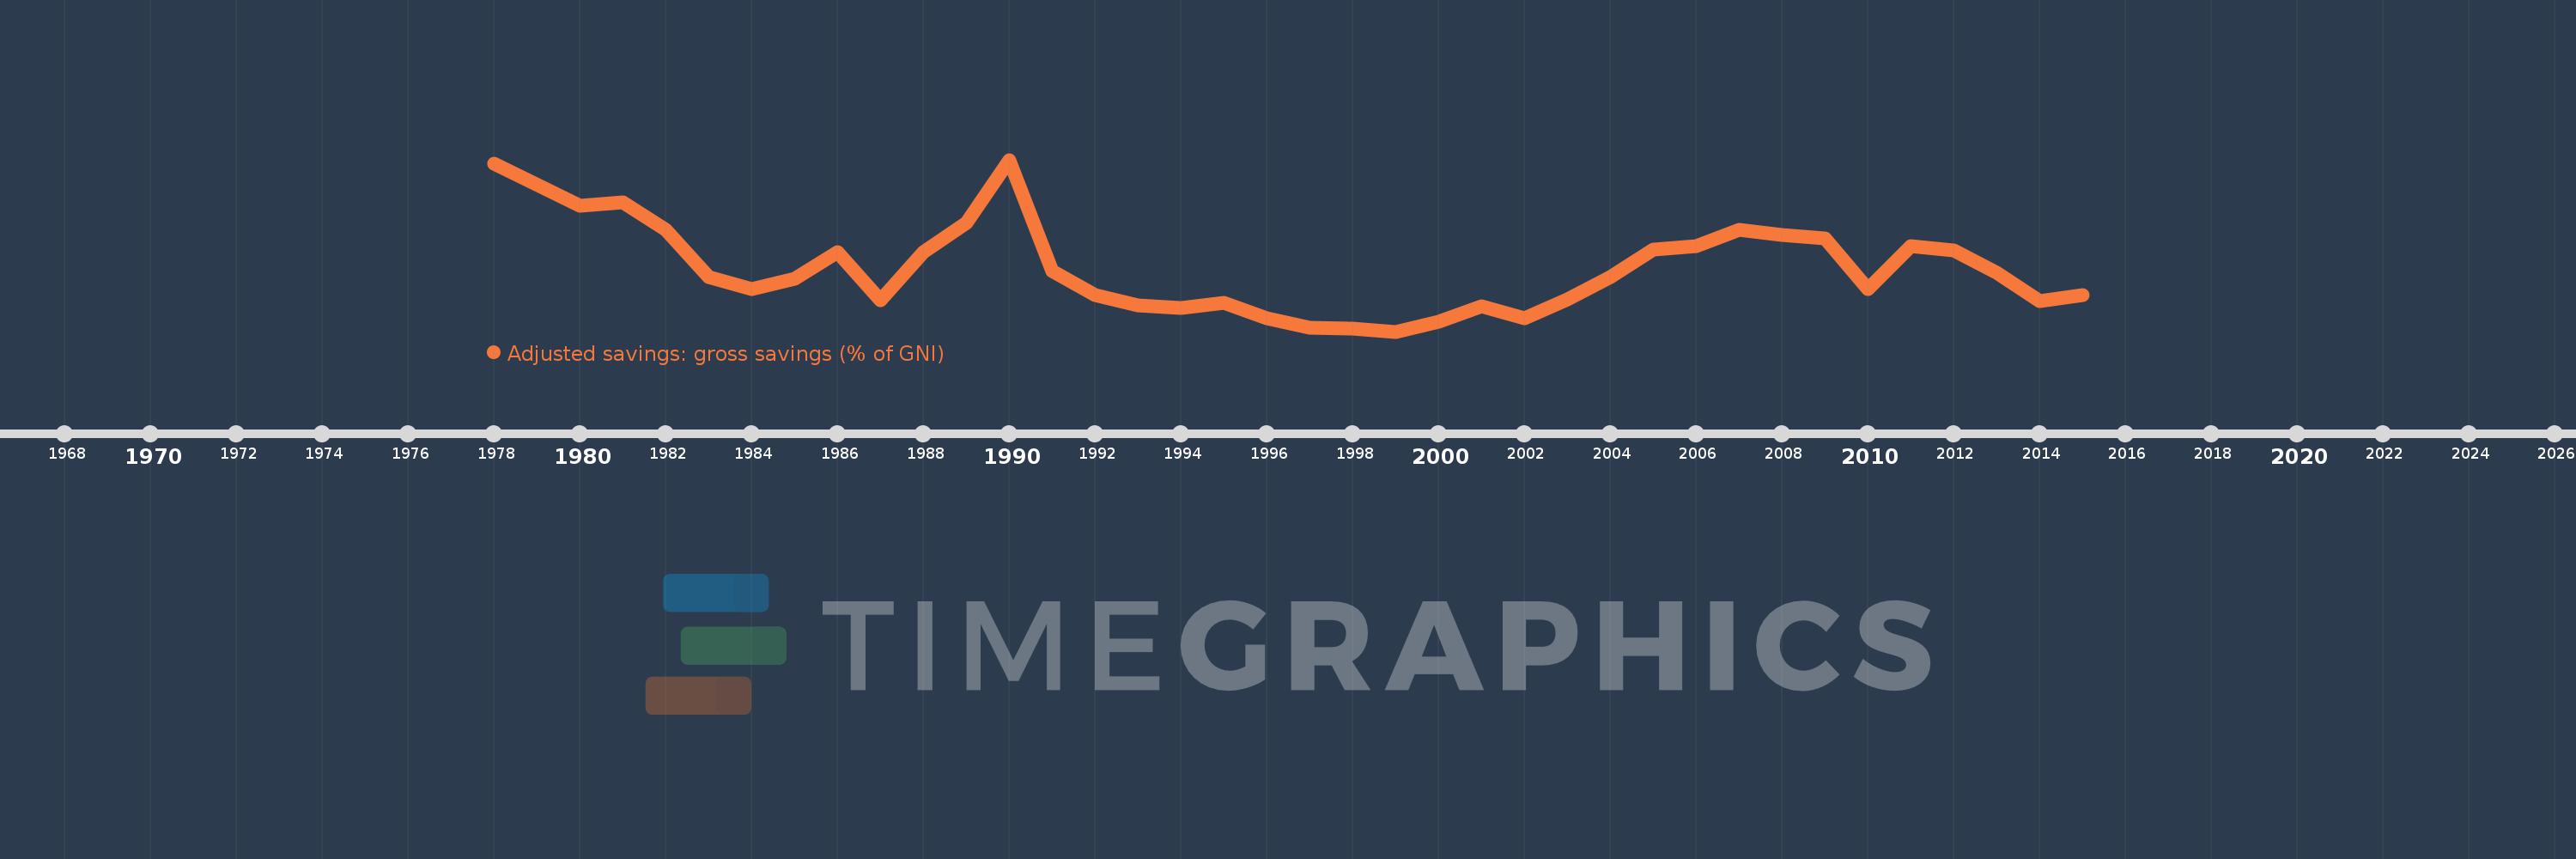
Adjusted savings: gross savings (% of GNI)
2015,2014,2013,2012,2011,2010,2009,2008,2007,2006,2005,2004,2003,2002,2001,2000,1999,1998,1997,1996,1995,1994,1993,1992,1991,1990,1989,1988,1987,1986,1985,1984,1983,1982,1981,1980,1978
Queste statistiche in altri paesi:
AfghanistanAlbaniaAlgeriaAngolaAntigua and BarbudaArab WorldArgentinaArmeniaAustraliaAustriaAzerbaijanBahamas, TheBahrainBangladeshBarbadosBelarusBelgiumBelizeBeninBermudaBhutanBoliviaBosnia and HerzegovinaBotswanaBrazilBrunei DarussalamBulgariaBurkina FasoBurundiCabo VerdeCambodiaCameroonCanadaCaribbean small statesCentral African RepublicCentral Europe and the BalticsChadChileChinaColombiaComorosCongo, Dem. Rep.Congo, Rep.Costa RicaCote d'IvoireCroatiaCyprusCzech RepublicDenmarkDjiboutiDominicaDominican RepublicEarly-demographic dividendEast Asia & PacificEast Asia & Pacific (excluding high income)East Asia & Pacific (IDA & IBRD countries)EcuadorEgypt, Arab Rep.El SalvadorEquatorial GuineaEritreaEstoniaEthiopiaEuro areaEurope & Central AsiaEurope & Central Asia (excluding high income)Europe & Central Asia (IDA & IBRD countries)European UnionFaroe IslandsFijiFinlandFragile and conflict affected situationsFranceGabonGambia, TheGeorgiaGermanyGhanaGreeceGrenadaGuatemalaGuineaGuinea-BissauGuyanaHaitiHeavily indebted poor countries (HIPC)High incomeHondurasHong Kong SAR, ChinaHungaryIBRD onlyIcelandIDA & IBRD totalIDA blendIDA onlyIDA totalIndiaIndonesiaIran, Islamic Rep.IraqIrelandIsraelItalyJamaicaJapanJordanKazakhstanKenyaKiribatiKorea, Rep.KosovoKuwaitKyrgyz RepublicLao PDRLate-demographic dividendLatin America & Caribbean Latin America & Caribbean (excluding high income)Latin America & the Caribbean (IDA & IBRD countries)LatviaLeast developed countries: UN classificationLebanonLesothoLiberiaLibyaLithuaniaLow & middle incomeLow incomeLower middle incomeLuxembourgMacao SAR, ChinaMacedonia, FYRMadagascarMalawiMalaysiaMaldivesMaliMaltaMauritaniaMauritiusMexicoMiddle East & North AfricaMiddle East & North Africa (excluding high income)Middle East & North Africa (IDA & IBRD countries)Middle incomeMoldovaMongoliaMontenegroMoroccoMozambiqueNamibiaNepalNetherlandsNew ZealandNicaraguaNigerNigeriaNorth AmericaNorwayOECD membersOmanOther small statesPacific island small statesPakistanPanamaPapua New GuineaParaguayPeruPhilippinesPolandPortugalPost-demographic dividendPre-demographic dividendQatarRomaniaRussian FederationRwandaSaudi ArabiaSenegalSerbiaSeychellesSierra LeoneSingaporeSlovak RepublicSloveniaSmall statesSolomon IslandsSouth AfricaSouth AsiaSouth Asia (IDA & IBRD)SpainSri LankaSt. Kitts and NevisSt. LuciaSt. Vincent and the GrenadinesSub-Saharan Africa Sub-Saharan Africa (excluding high income)Sub-Saharan Africa (IDA & IBRD countries)SudanSurinameSwazilandSwedenSwitzerlandSyrian Arab RepublicTajikistanTanzaniaThailandTimor-LesteTogoTongaTrinidad and TobagoTunisiaTurkeyTurkmenistanUgandaUkraineUnited KingdomUnited StatesUpper middle incomeUruguayVanuatuVenezuela, RBVietnamWest Bank and GazaWorldYemen, Rep.ZambiaZimbabwe Linea del tempo:
Questa scala temporale mostra un grafico dal 1978 anno al 2015 anno. Latin America & the Caribbean (IDA & IBRD countries). I dati fino ad 1977 anno non disponibili. Il numero di osservazioni attuali secondo i date: 37.
La fonte (nome):
Indicatori dello sviluppo mondiale
La fonte (organizzazione):
World Bank national accounts data files.
Categorie:
Economy & Growth, Environment
sono stati aggiornati
23 apr 2017 anni
Indicatori delle variazioni dei valori per anni
Minima:
16.067
1 gen 1999 anni
Massimo:
26.8
1 gen 1990 anni
Alla data di osservazione
Valore
Variazione assoluta
La variazione rispetto al valore precedente
1 gen 1978 anni
26.585
+26.585
0.0%
1 gen 1980 anni
23.918
-2.667
-10.03%
1 gen 1981 anni
24.145
+0.227
0.95%
1 gen 1982 anni
22.414
-1.73
-7.17%
1 gen 1983 anni
19.455
-2.959
-13.2%
1 gen 1984 anni
18.748
-0.707
-3.63%
1 gen 1985 anni
19.378
+0.63
3.36%
1 gen 1986 anni
21.038
+1.66
8.56%
1 gen 1987 anni
18.003
-3.034
-14.42%
1 gen 1988 anni
21.045
+3.041
16.89%
1 gen 1989 anni
22.845
+1.8
8.56%
1 gen 1990 anni
26.8
+3.955
17.31%
1 gen 1991 anni
19.874
-6.926
-25.84%
1 gen 1992 anni
18.355
-1.519
-7.64%
1 gen 1993 anni
17.7
-0.655
-3.57%
1 gen 1994 anni
17.524
-0.177
-1.0%
1 gen 1995 anni
17.862
+0.338
1.93%
1 gen 1996 anni
16.906
-0.956
-5.35%
1 gen 1997 anni
16.306
-0.6
-3.55%
1 gen 1998 anni
16.281
-0.025
-0.15%
1 gen 1999 anni
16.067
-0.214
-1.31%
1 gen 2000 anni
16.684
+0.617
3.84%
1 gen 2001 anni
17.676
+0.992
5.94%
1 gen 2002 anni
16.903
-0.773
-4.37%
1 gen 2003 anni
18.081
+1.179
6.97%
1 gen 2004 anni
19.501
+1.42
7.85%
1 gen 2005 anni
21.199
+1.698
8.71%
1 gen 2006 anni
21.396
+0.196
0.93%
1 gen 2007 anni
22.427
+1.031
4.82%
1 gen 2008 anni
22.126
-0.301
-1.34%
1 gen 2009 anni
21.898
-0.228
-1.03%
1 gen 2010 anni
18.727
-3.171
-14.48%
1 gen 2011 anni
21.406
+2.679
14.3%
1 gen 2012 anni
21.135
-0.271
-1.27%
1 gen 2013 anni
19.758
-1.376
-6.51%
1 gen 2014 anni
17.959
-1.8
-9.11%
1 gen 2015 anni
18.336
+0.377
2.1%
Classificazione dei paesi secondo i statistiche attuali per anni


Commenti: