29
/it/
it
AIzaSyAYiBZKx7MnpbEhh9jyipgxe19OcubqV5w
April 1, 2024
266509
Trinidad and Tobago
TTO
true
2
1
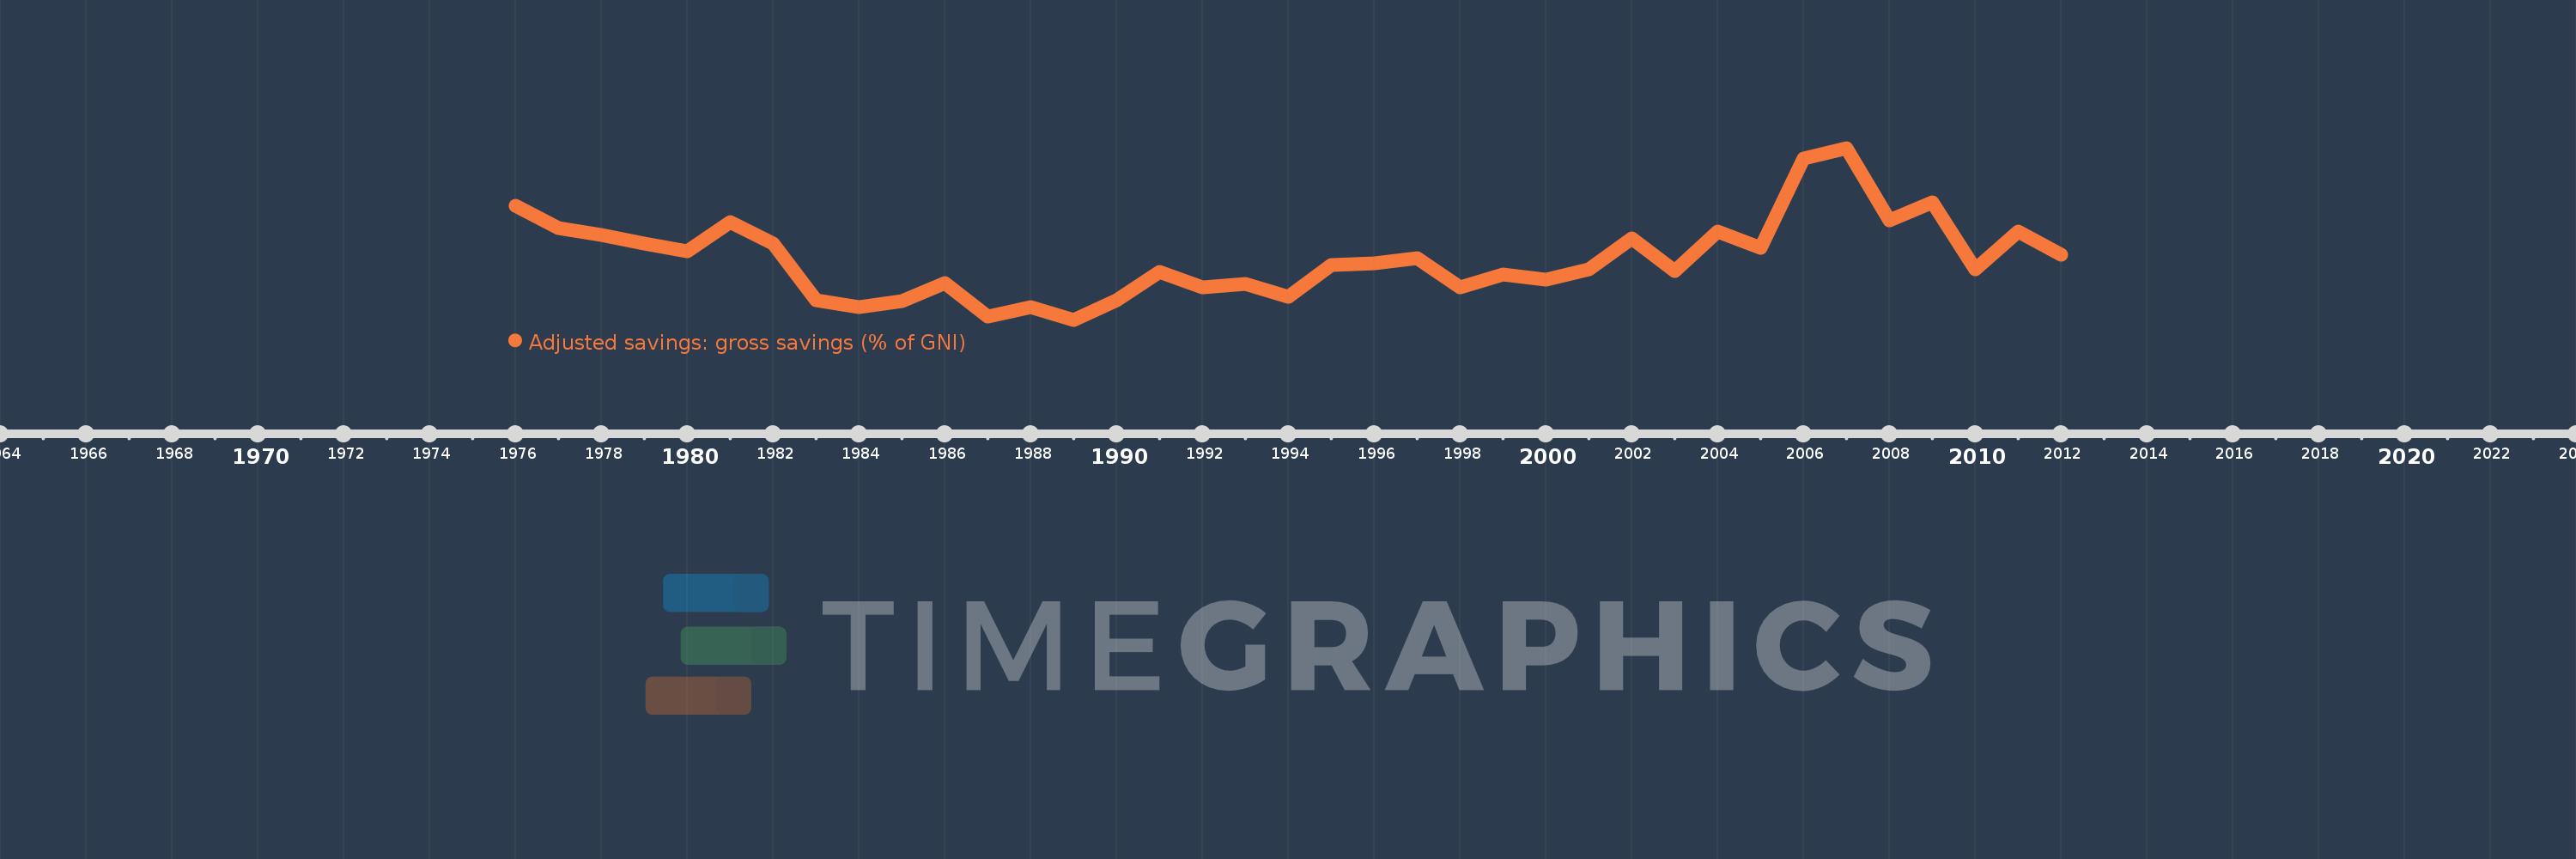
Adjusted savings: gross savings (% of GNI)
2012,2011,2010,2009,2008,2007,2006,2005,2004,2003,2002,2001,2000,1999,1998,1997,1996,1995,1994,1993,1992,1991,1990,1989,1988,1987,1986,1985,1984,1983,1982,1981,1980,1979,1978,1977,1976
Queste statistiche in altri paesi:
AfghanistanAlbaniaAlgeriaAngolaAntigua and BarbudaArab WorldArgentinaArmeniaAustraliaAustriaAzerbaijanBahamas, TheBahrainBangladeshBarbadosBelarusBelgiumBelizeBeninBermudaBhutanBoliviaBosnia and HerzegovinaBotswanaBrazilBrunei DarussalamBulgariaBurkina FasoBurundiCabo VerdeCambodiaCameroonCanadaCaribbean small statesCentral African RepublicCentral Europe and the BalticsChadChileChinaColombiaComorosCongo, Dem. Rep.Congo, Rep.Costa RicaCote d'IvoireCroatiaCyprusCzech RepublicDenmarkDjiboutiDominicaDominican RepublicEarly-demographic dividendEast Asia & PacificEast Asia & Pacific (excluding high income)East Asia & Pacific (IDA & IBRD countries)EcuadorEgypt, Arab Rep.El SalvadorEquatorial GuineaEritreaEstoniaEthiopiaEuro areaEurope & Central AsiaEurope & Central Asia (excluding high income)Europe & Central Asia (IDA & IBRD countries)European UnionFaroe IslandsFijiFinlandFragile and conflict affected situationsFranceGabonGambia, TheGeorgiaGermanyGhanaGreeceGrenadaGuatemalaGuineaGuinea-BissauGuyanaHaitiHeavily indebted poor countries (HIPC)High incomeHondurasHong Kong SAR, ChinaHungaryIBRD onlyIcelandIDA & IBRD totalIDA blendIDA onlyIDA totalIndiaIndonesiaIran, Islamic Rep.IraqIrelandIsraelItalyJamaicaJapanJordanKazakhstanKenyaKiribatiKorea, Rep.KosovoKuwaitKyrgyz RepublicLao PDRLate-demographic dividendLatin America & Caribbean Latin America & Caribbean (excluding high income)Latin America & the Caribbean (IDA & IBRD countries)LatviaLeast developed countries: UN classificationLebanonLesothoLiberiaLibyaLithuaniaLow & middle incomeLow incomeLower middle incomeLuxembourgMacao SAR, ChinaMacedonia, FYRMadagascarMalawiMalaysiaMaldivesMaliMaltaMauritaniaMauritiusMexicoMiddle East & North AfricaMiddle East & North Africa (excluding high income)Middle East & North Africa (IDA & IBRD countries)Middle incomeMoldovaMongoliaMontenegroMoroccoMozambiqueNamibiaNepalNetherlandsNew ZealandNicaraguaNigerNigeriaNorth AmericaNorwayOECD membersOmanOther small statesPacific island small statesPakistanPanamaPapua New GuineaParaguayPeruPhilippinesPolandPortugalPost-demographic dividendPre-demographic dividendQatarRomaniaRussian FederationRwandaSaudi ArabiaSenegalSerbiaSeychellesSierra LeoneSingaporeSlovak RepublicSloveniaSmall statesSolomon IslandsSouth AfricaSouth AsiaSouth Asia (IDA & IBRD)SpainSri LankaSt. Kitts and NevisSt. LuciaSt. Vincent and the GrenadinesSub-Saharan Africa Sub-Saharan Africa (excluding high income)Sub-Saharan Africa (IDA & IBRD countries)SudanSurinameSwazilandSwedenSwitzerlandSyrian Arab RepublicTajikistanTanzaniaThailandTimor-LesteTogoTongaTrinidad and TobagoTunisiaTurkeyTurkmenistanUgandaUkraineUnited KingdomUnited StatesUpper middle incomeUruguayVanuatuVenezuela, RBVietnamWest Bank and GazaWorldYemen, Rep.ZambiaZimbabwe Linea del tempo:
Questa scala temporale mostra un grafico dal 1976 anno al 2012 anno. Trinidad and Tobago. I dati fino ad 1975 anno non disponibili. Il numero di osservazioni attuali secondo i date: 37.
La fonte (nome):
Indicatori dello sviluppo mondiale
La fonte (organizzazione):
World Bank national accounts data files.
Categorie:
Economy & Growth, Environment
sono stati aggiornati
23 apr 2017 anni
Indicatori delle variazioni dei valori per anni
Minima:
11.691
1 gen 1989 anni
Massimo:
58.204
1 gen 2007 anni
Alla data di osservazione
Valore
Variazione assoluta
La variazione rispetto al valore precedente
1 gen 1976 anni
42.658
+42.658
0.0%
1 gen 1977 anni
36.514
-6.144
-14.4%
1 gen 1978 anni
34.559
-1.954
-5.35%
1 gen 1979 anni
32.393
-2.167
-6.27%
1 gen 1980 anni
30.301
-2.092
-6.46%
1 gen 1981 anni
38.094
+7.793
25.72%
1 gen 1982 anni
32.296
-5.798
-15.22%
1 gen 1983 anni
17.015
-15.281
-47.31%
1 gen 1984 anni
15.042
-1.973
-11.6%
1 gen 1985 anni
16.622
+1.58
10.5%
1 gen 1986 anni
21.666
+5.044
30.35%
1 gen 1987 anni
12.532
-9.134
-42.16%
1 gen 1988 anni
15.203
+2.672
21.32%
1 gen 1989 anni
11.691
-3.512
-23.1%
1 gen 1990 anni
16.969
+5.278
45.14%
1 gen 1991 anni
24.608
+7.639
45.02%
1 gen 1992 anni
20.54
-4.068
-16.53%
1 gen 1993 anni
21.504
+0.964
4.69%
1 gen 1994 anni
17.915
-3.589
-16.69%
1 gen 1995 anni
26.589
+8.674
48.42%
1 gen 1996 anni
27.036
+0.447
1.68%
1 gen 1997 anni
28.419
+1.383
5.12%
1 gen 1998 anni
20.542
-7.877
-27.72%
1 gen 1999 anni
23.841
+3.298
16.05%
1 gen 2000 anni
22.539
-1.301
-5.46%
1 gen 2001 anni
25.42
+2.881
12.78%
1 gen 2002 anni
33.819
+8.399
33.04%
1 gen 2003 anni
24.794
-9.024
-26.68%
1 gen 2004 anni
35.658
+10.864
43.81%
1 gen 2005 anni
31.153
-4.505
-12.63%
1 gen 2006 anni
55.302
+24.149
77.52%
1 gen 2007 anni
58.204
+2.903
5.25%
1 gen 2008 anni
38.502
-19.703
-33.85%
1 gen 2009 anni
43.496
+4.994
12.97%
1 gen 2010 anni
25.307
-18.188
-41.82%
1 gen 2011 anni
35.468
+10.161
40.15%
1 gen 2012 anni
29.391
-6.077
-17.13%
Classificazione dei paesi secondo i statistiche attuali per anni


Commenti: