29
/it/
it
AIzaSyAYiBZKx7MnpbEhh9jyipgxe19OcubqV5w
April 1, 2024
275387
United Kingdom
GBR
true
2
1
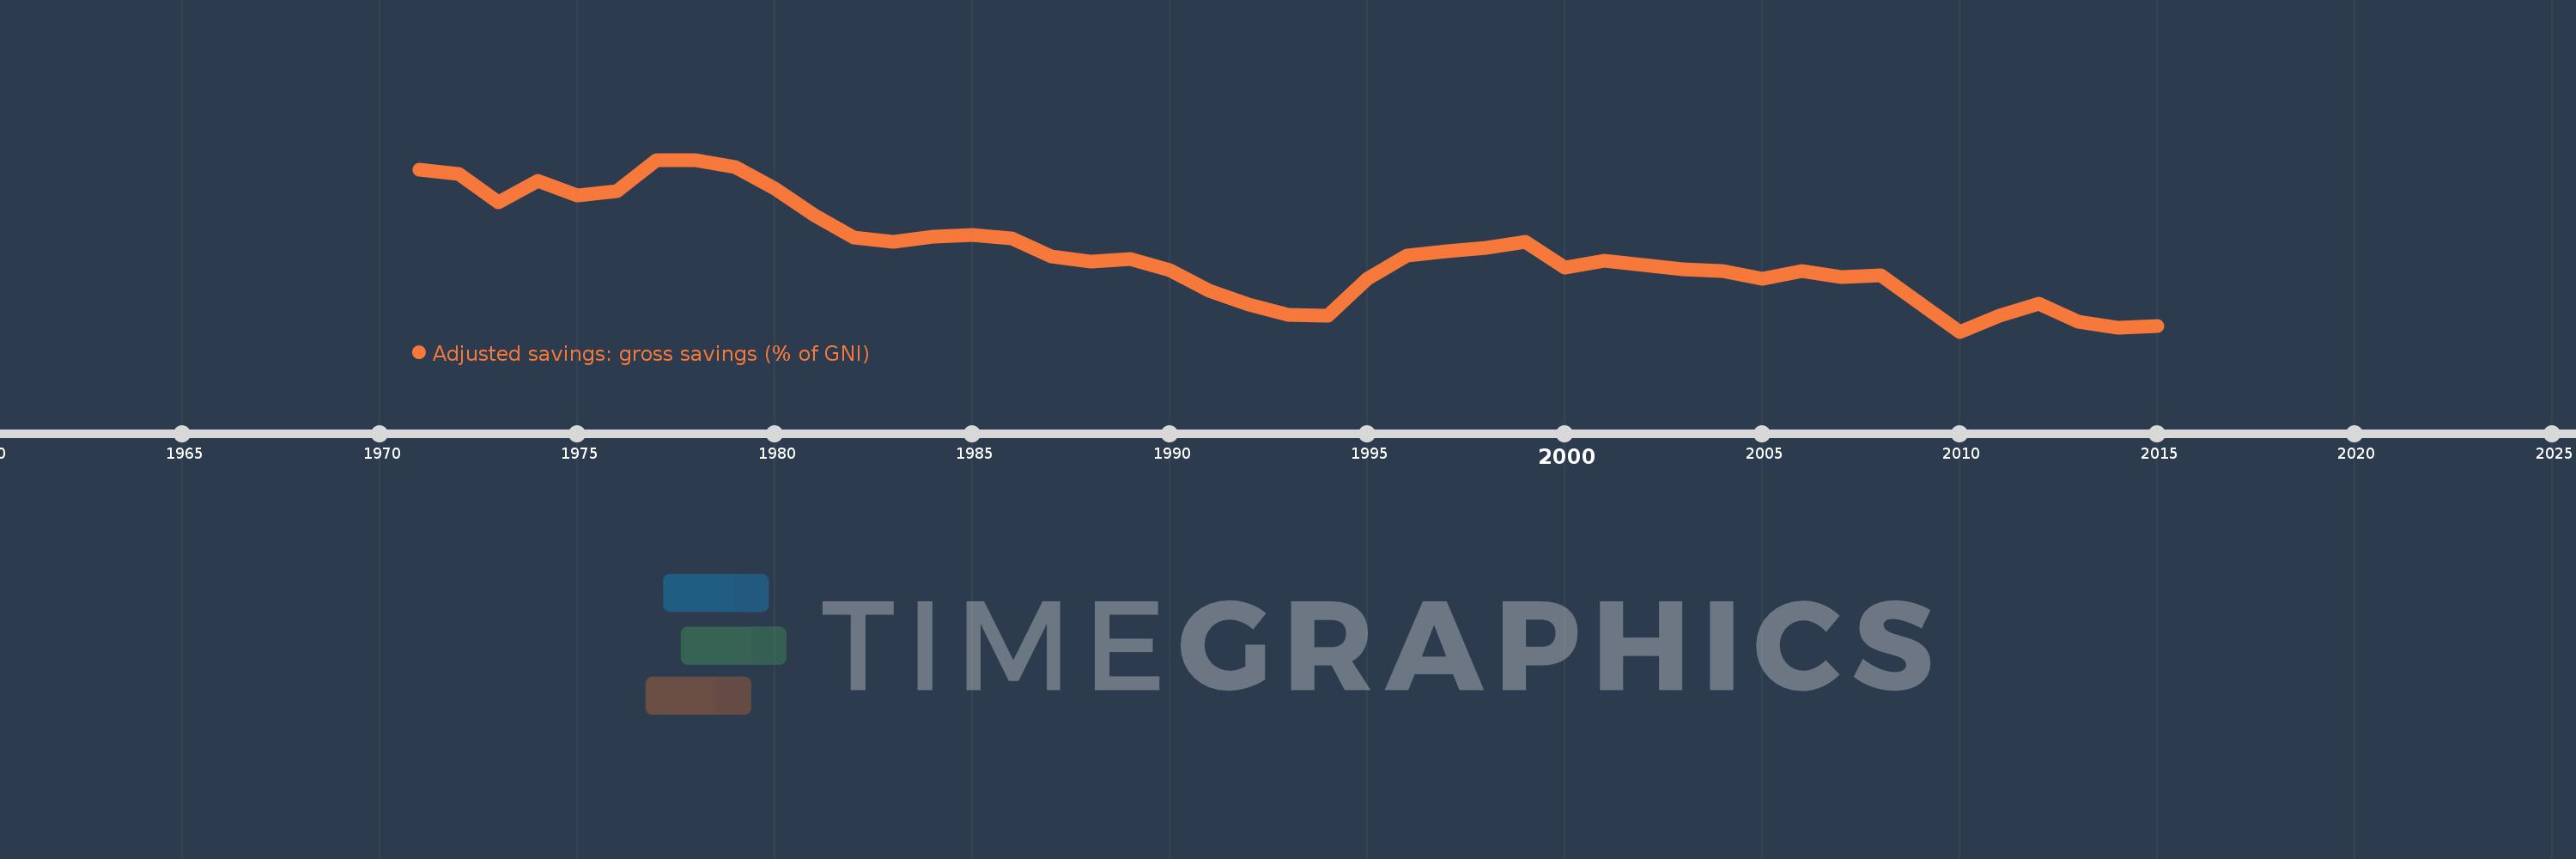
Adjusted savings: gross savings (% of GNI)
2015,2014,2013,2012,2011,2010,2009,2008,2007,2006,2005,2004,2003,2002,2001,2000,1999,1998,1997,1996,1995,1994,1993,1992,1991,1990,1989,1988,1987,1986,1985,1984,1983,1982,1981,1980,1979,1978,1977,1976,1975,1974,1973,1972,1971
Queste statistiche in altri paesi:
AfghanistanAlbaniaAlgeriaAngolaAntigua and BarbudaArab WorldArgentinaArmeniaAustraliaAustriaAzerbaijanBahamas, TheBahrainBangladeshBarbadosBelarusBelgiumBelizeBeninBermudaBhutanBoliviaBosnia and HerzegovinaBotswanaBrazilBrunei DarussalamBulgariaBurkina FasoBurundiCabo VerdeCambodiaCameroonCanadaCaribbean small statesCentral African RepublicCentral Europe and the BalticsChadChileChinaColombiaComorosCongo, Dem. Rep.Congo, Rep.Costa RicaCote d'IvoireCroatiaCyprusCzech RepublicDenmarkDjiboutiDominicaDominican RepublicEarly-demographic dividendEast Asia & PacificEast Asia & Pacific (excluding high income)East Asia & Pacific (IDA & IBRD countries)EcuadorEgypt, Arab Rep.El SalvadorEquatorial GuineaEritreaEstoniaEthiopiaEuro areaEurope & Central AsiaEurope & Central Asia (excluding high income)Europe & Central Asia (IDA & IBRD countries)European UnionFaroe IslandsFijiFinlandFragile and conflict affected situationsFranceGabonGambia, TheGeorgiaGermanyGhanaGreeceGrenadaGuatemalaGuineaGuinea-BissauGuyanaHaitiHeavily indebted poor countries (HIPC)High incomeHondurasHong Kong SAR, ChinaHungaryIBRD onlyIcelandIDA & IBRD totalIDA blendIDA onlyIDA totalIndiaIndonesiaIran, Islamic Rep.IraqIrelandIsraelItalyJamaicaJapanJordanKazakhstanKenyaKiribatiKorea, Rep.KosovoKuwaitKyrgyz RepublicLao PDRLate-demographic dividendLatin America & Caribbean Latin America & Caribbean (excluding high income)Latin America & the Caribbean (IDA & IBRD countries)LatviaLeast developed countries: UN classificationLebanonLesothoLiberiaLibyaLithuaniaLow & middle incomeLow incomeLower middle incomeLuxembourgMacao SAR, ChinaMacedonia, FYRMadagascarMalawiMalaysiaMaldivesMaliMaltaMauritaniaMauritiusMexicoMiddle East & North AfricaMiddle East & North Africa (excluding high income)Middle East & North Africa (IDA & IBRD countries)Middle incomeMoldovaMongoliaMontenegroMoroccoMozambiqueNamibiaNepalNetherlandsNew ZealandNicaraguaNigerNigeriaNorth AmericaNorwayOECD membersOmanOther small statesPacific island small statesPakistanPanamaPapua New GuineaParaguayPeruPhilippinesPolandPortugalPost-demographic dividendPre-demographic dividendQatarRomaniaRussian FederationRwandaSaudi ArabiaSenegalSerbiaSeychellesSierra LeoneSingaporeSlovak RepublicSloveniaSmall statesSolomon IslandsSouth AfricaSouth AsiaSouth Asia (IDA & IBRD)SpainSri LankaSt. Kitts and NevisSt. LuciaSt. Vincent and the GrenadinesSub-Saharan Africa Sub-Saharan Africa (excluding high income)Sub-Saharan Africa (IDA & IBRD countries)SudanSurinameSwazilandSwedenSwitzerlandSyrian Arab RepublicTajikistanTanzaniaThailandTimor-LesteTogoTongaTrinidad and TobagoTunisiaTurkeyTurkmenistanUgandaUkraineUnited KingdomUnited StatesUpper middle incomeUruguayVanuatuVenezuela, RBVietnamWest Bank and GazaWorldYemen, Rep.ZambiaZimbabwe Linea del tempo:
Questa scala temporale mostra un grafico dal 1971 anno al 2015 anno. United Kingdom. I dati fino ad 1970 anno non disponibili. Il numero di osservazioni attuali secondo i date: 45.
La fonte (nome):
Indicatori dello sviluppo mondiale
La fonte (organizzazione):
World Bank national accounts data files.
Categorie:
Economy & Growth, Environment
sono stati aggiornati
23 apr 2017 anni
Indicatori delle variazioni dei valori per anni
Minima:
12.21
1 gen 2010 anni
Massimo:
25.165
1 gen 1977 anni
Alla data di osservazione
Valore
Variazione assoluta
La variazione rispetto al valore precedente
1 gen 1971 anni
24.423
+24.423
0.0%
1 gen 1972 anni
24.079
-0.345
-1.41%
1 gen 1973 anni
21.953
-2.125
-8.83%
1 gen 1974 anni
23.573
+1.62
7.38%
1 gen 1975 anni
22.465
-1.108
-4.7%
1 gen 1976 anni
22.808
+0.342
1.52%
1 gen 1977 anni
25.165
+2.358
10.34%
1 gen 1978 anni
25.153
-0.013
-0.05%
1 gen 1979 anni
24.583
-0.57
-2.27%
1 gen 1980 anni
22.971
-1.612
-6.56%
1 gen 1981 anni
20.974
-1.997
-8.69%
1 gen 1982 anni
19.334
-1.64
-7.82%
1 gen 1983 anni
18.981
-0.353
-1.83%
1 gen 1984 anni
19.369
+0.388
2.05%
1 gen 1985 anni
19.496
+0.127
0.66%
1 gen 1986 anni
19.213
-0.283
-1.45%
1 gen 1987 anni
17.902
-1.311
-6.83%
1 gen 1988 anni
17.521
-0.381
-2.13%
1 gen 1989 anni
17.689
+0.168
0.96%
1 gen 1990 anni
16.849
-0.84
-4.75%
1 gen 1991 anni
15.299
-1.55
-9.2%
1 gen 1992 anni
14.272
-1.027
-6.71%
1 gen 1993 anni
13.493
-0.779
-5.46%
1 gen 1994 anni
13.436
-0.058
-0.43%
1 gen 1995 anni
16.191
+2.756
20.51%
1 gen 1996 anni
17.964
+1.772
10.95%
1 gen 1997 anni
18.271
+0.308
1.71%
1 gen 1998 anni
18.533
+0.262
1.44%
1 gen 1999 anni
18.955
+0.421
2.27%
1 gen 2000 anni
17.064
-1.891
-9.97%
1 gen 2001 anni
17.529
+0.465
2.72%
1 gen 2002 anni
17.219
-0.31
-1.77%
1 gen 2003 anni
16.901
-0.318
-1.85%
1 gen 2004 anni
16.767
-0.134
-0.79%
1 gen 2005 anni
16.199
-0.568
-3.39%
1 gen 2006 anni
16.774
+0.575
3.55%
1 gen 2007 anni
16.295
-0.479
-2.86%
1 gen 2008 anni
16.485
+0.19
1.17%
1 gen 2009 anni
14.319
-2.166
-13.14%
1 gen 2010 anni
12.21
-2.109
-14.73%
1 gen 2011 anni
13.388
+1.178
9.65%
1 gen 2012 anni
14.289
+0.901
6.73%
1 gen 2013 anni
12.956
-1.333
-9.33%
1 gen 2014 anni
12.52
-0.436
-3.37%
1 gen 2015 anni
12.625
+0.105
0.84%
Classificazione dei paesi secondo i statistiche attuali per anni


Commenti: