29
/it/
it
AIzaSyAYiBZKx7MnpbEhh9jyipgxe19OcubqV5w
April 1, 2024
41525
Latin America & Caribbean
LCN
false
2
1
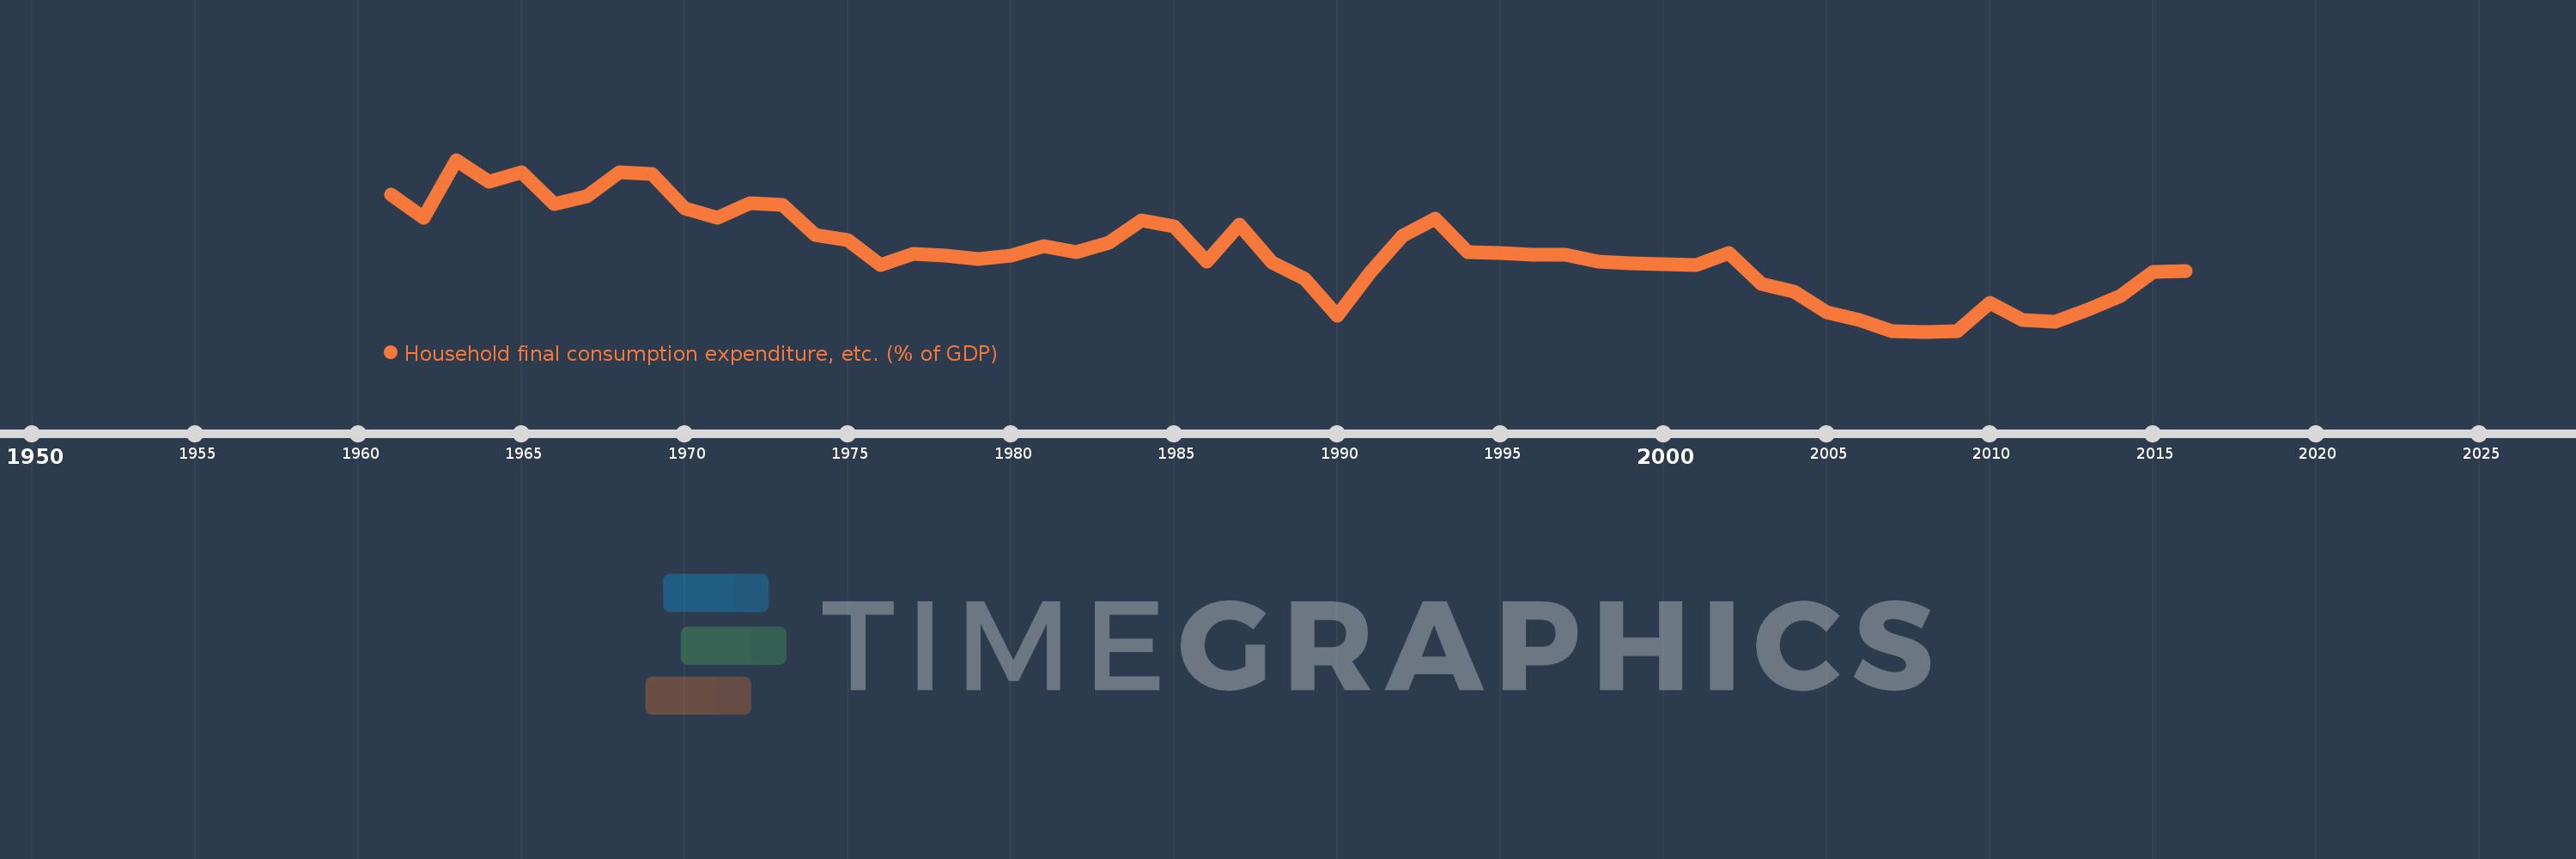
Household final consumption expenditure, etc. (% of GDP)
2016,2015,2014,2013,2012,2011,2010,2009,2008,2007,2006,2005,2004,2003,2002,2001,2000,1999,1998,1997,1996,1995,1994,1993,1992,1991,1990,1989,1988,1987,1986,1985,1984,1983,1982,1981,1980,1979,1978,1977,1976,1975,1974,1973,1972,1971,1970,1969,1968,1967,1966,1965,1964,1963,1962,1961
Queste statistiche in altri paesi:
AfghanistanAlbaniaAlgeriaAngolaAntigua and BarbudaArab WorldArgentinaArmeniaArubaAustraliaAustriaAzerbaijanBahamas, TheBahrainBangladeshBarbadosBelarusBelgiumBelizeBeninBermudaBhutanBoliviaBosnia and HerzegovinaBotswanaBrazilBrunei DarussalamBulgariaBurkina FasoBurundiCabo VerdeCambodiaCameroonCanadaCaribbean small statesCentral African RepublicCentral Europe and the BalticsChadChileChinaColombiaComorosCongo, Dem. Rep.Congo, Rep.Costa RicaCote d'IvoireCroatiaCubaCyprusCzech RepublicDenmarkDjiboutiDominicaDominican RepublicEarly-demographic dividendEast Asia & PacificEast Asia & Pacific (excluding high income)East Asia & Pacific (IDA & IBRD countries)EcuadorEgypt, Arab Rep.El SalvadorEquatorial GuineaEritreaEstoniaEthiopiaEuro areaEurope & Central AsiaEurope & Central Asia (excluding high income)Europe & Central Asia (IDA & IBRD countries)European UnionFaroe IslandsFijiFinlandFragile and conflict affected situationsFranceGabonGambia, TheGeorgiaGermanyGhanaGreeceGrenadaGuatemalaGuineaGuinea-BissauGuyanaHaitiHeavily indebted poor countries (HIPC)High incomeHondurasHong Kong SAR, ChinaHungaryIBRD onlyIcelandIDA & IBRD totalIDA blendIDA onlyIDA totalIndiaIndonesiaIran, Islamic Rep.IraqIrelandIsraelItalyJamaicaJapanJordanKazakhstanKenyaKiribatiKorea, Rep.KosovoKuwaitKyrgyz RepublicLao PDRLate-demographic dividendLatin America & Caribbean Latin America & Caribbean (excluding high income)Latin America & the Caribbean (IDA & IBRD countries)LatviaLeast developed countries: UN classificationLebanonLesothoLiberiaLibyaLithuaniaLow & middle incomeLow incomeLower middle incomeLuxembourgMacao SAR, ChinaMacedonia, FYRMadagascarMalawiMalaysiaMaldivesMaliMaltaMauritaniaMauritiusMexicoMicronesia, Fed. Sts.Middle East & North AfricaMiddle East & North Africa (excluding high income)Middle East & North Africa (IDA & IBRD countries)Middle incomeMoldovaMongoliaMontenegroMoroccoMozambiqueNamibiaNepalNetherlandsNew CaledoniaNew ZealandNicaraguaNigerNigeriaNorth AmericaNorwayOECD membersOmanOther small statesPacific island small statesPakistanPanamaPapua New GuineaParaguayPeruPhilippinesPolandPortugalPost-demographic dividendPre-demographic dividendPuerto RicoQatarRomaniaRussian FederationRwandaSaudi ArabiaSenegalSerbiaSeychellesSierra LeoneSingaporeSlovak RepublicSloveniaSmall statesSolomon IslandsSomaliaSouth AfricaSouth AsiaSouth Asia (IDA & IBRD)South SudanSpainSri LankaSt. Kitts and NevisSt. LuciaSt. Vincent and the GrenadinesSub-Saharan Africa Sub-Saharan Africa (excluding high income)Sub-Saharan Africa (IDA & IBRD countries)SudanSurinameSwazilandSwedenSwitzerlandSyrian Arab RepublicTajikistanTanzaniaThailandTimor-LesteTogoTongaTrinidad and TobagoTunisiaTurkeyTurkmenistanUgandaUkraineUnited Arab EmiratesUnited KingdomUnited StatesUpper middle incomeUruguayUzbekistanVanuatuVenezuela, RBVietnamWest Bank and GazaWorldYemen, Rep.ZambiaZimbabwe Linea del tempo:
Questa scala temporale mostra un grafico dal 1961 anno al 2016 anno. Latin America & Caribbean . I dati fino ad 1960 anno non disponibili. Il numero di osservazioni attuali secondo i date: 56.
La fonte (nome):
Indicatori dello sviluppo mondiale
La fonte (organizzazione):
World Bank national accounts data, and OECD National Accounts data files.
Categorie:
Economy & Growth
sono stati aggiornati
23 apr 2017 anni
Indicatori delle variazioni dei valori per anni
Minima:
61.986
1 gen 2008 anni
Massimo:
71.319
1 gen 1963 anni
Alla data di osservazione
Valore
Variazione assoluta
La variazione rispetto al valore precedente
1 gen 1961 anni
69.421
+69.421
0.0%
1 gen 1962 anni
68.192
-1.229
-1.77%
1 gen 1963 anni
71.319
+3.126
4.58%
1 gen 1964 anni
70.145
-1.174
-1.65%
1 gen 1965 anni
70.635
+0.491
0.7%
1 gen 1966 anni
68.918
-1.717
-2.43%
1 gen 1967 anni
69.323
+0.405
0.59%
1 gen 1968 anni
70.645
+1.322
1.91%
1 gen 1969 anni
70.56
-0.086
-0.12%
1 gen 1970 anni
68.66
-1.9
-2.69%
1 gen 1971 anni
68.18
-0.479
-0.7%
1 gen 1972 anni
68.952
+0.772
1.13%
1 gen 1973 anni
68.862
-0.09
-0.13%
1 gen 1974 anni
67.233
-1.629
-2.37%
1 gen 1975 anni
66.943
-0.289
-0.43%
1 gen 1976 anni
65.593
-1.35
-2.02%
1 gen 1977 anni
66.196
+0.602
0.92%
1 gen 1978 anni
66.123
-0.073
-0.11%
1 gen 1979 anni
65.952
-0.171
-0.26%
1 gen 1980 anni
66.105
+0.154
0.23%
1 gen 1981 anni
66.647
+0.541
0.82%
1 gen 1982 anni
66.319
-0.328
-0.49%
1 gen 1983 anni
66.821
+0.502
0.76%
1 gen 1984 anni
68.018
+1.197
1.79%
1 gen 1985 anni
67.69
-0.327
-0.48%
1 gen 1986 anni
65.771
-1.919
-2.84%
1 gen 1987 anni
67.795
+2.025
3.08%
1 gen 1988 anni
65.751
-2.044
-3.02%
1 gen 1989 anni
64.853
-0.899
-1.37%
1 gen 1990 anni
62.84
-2.013
-3.1%
1 gen 1991 anni
65.162
+2.322
3.7%
1 gen 1992 anni
67.205
+2.043
3.13%
1 gen 1993 anni
68.12
+0.916
1.36%
1 gen 1994 anni
66.32
-1.8
-2.64%
1 gen 1995 anni
66.278
-0.043
-0.06%
1 gen 1996 anni
66.145
-0.132
-0.2%
1 gen 1997 anni
66.163
+0.017
0.03%
1 gen 1998 anni
65.769
-0.394
-0.6%
1 gen 1999 anni
65.719
-0.05
-0.08%
1 gen 2000 anni
65.67
-0.049
-0.07%
1 gen 2001 anni
65.587
-0.083
-0.13%
1 gen 2002 anni
66.238
+0.651
0.99%
1 gen 2003 anni
64.574
-1.664
-2.51%
1 gen 2004 anni
64.151
-0.423
-0.65%
1 gen 2005 anni
63.035
-1.116
-1.74%
1 gen 2006 anni
62.63
-0.404
-0.64%
1 gen 2007 anni
62.008
-0.623
-0.99%
1 gen 2008 anni
61.986
-0.021
-0.03%
1 gen 2009 anni
61.991
+0.005
0.01%
1 gen 2010 anni
63.564
+1.572
2.54%
1 gen 2011 anni
62.635
-0.928
-1.46%
1 gen 2012 anni
62.513
-0.122
-0.2%
1 gen 2013 anni
63.166
+0.653
1.05%
1 gen 2014 anni
63.944
+0.778
1.23%
1 gen 2015 anni
65.214
+1.27
1.99%
1 gen 2016 anni
65.299
+0.085
0.13%
Classificazione dei paesi secondo i statistiche attuali per anni


Commenti: