29
/it/
it
AIzaSyAYiBZKx7MnpbEhh9jyipgxe19OcubqV5w
April 1, 2024
257405
Switzerland
CHE
true
2
1
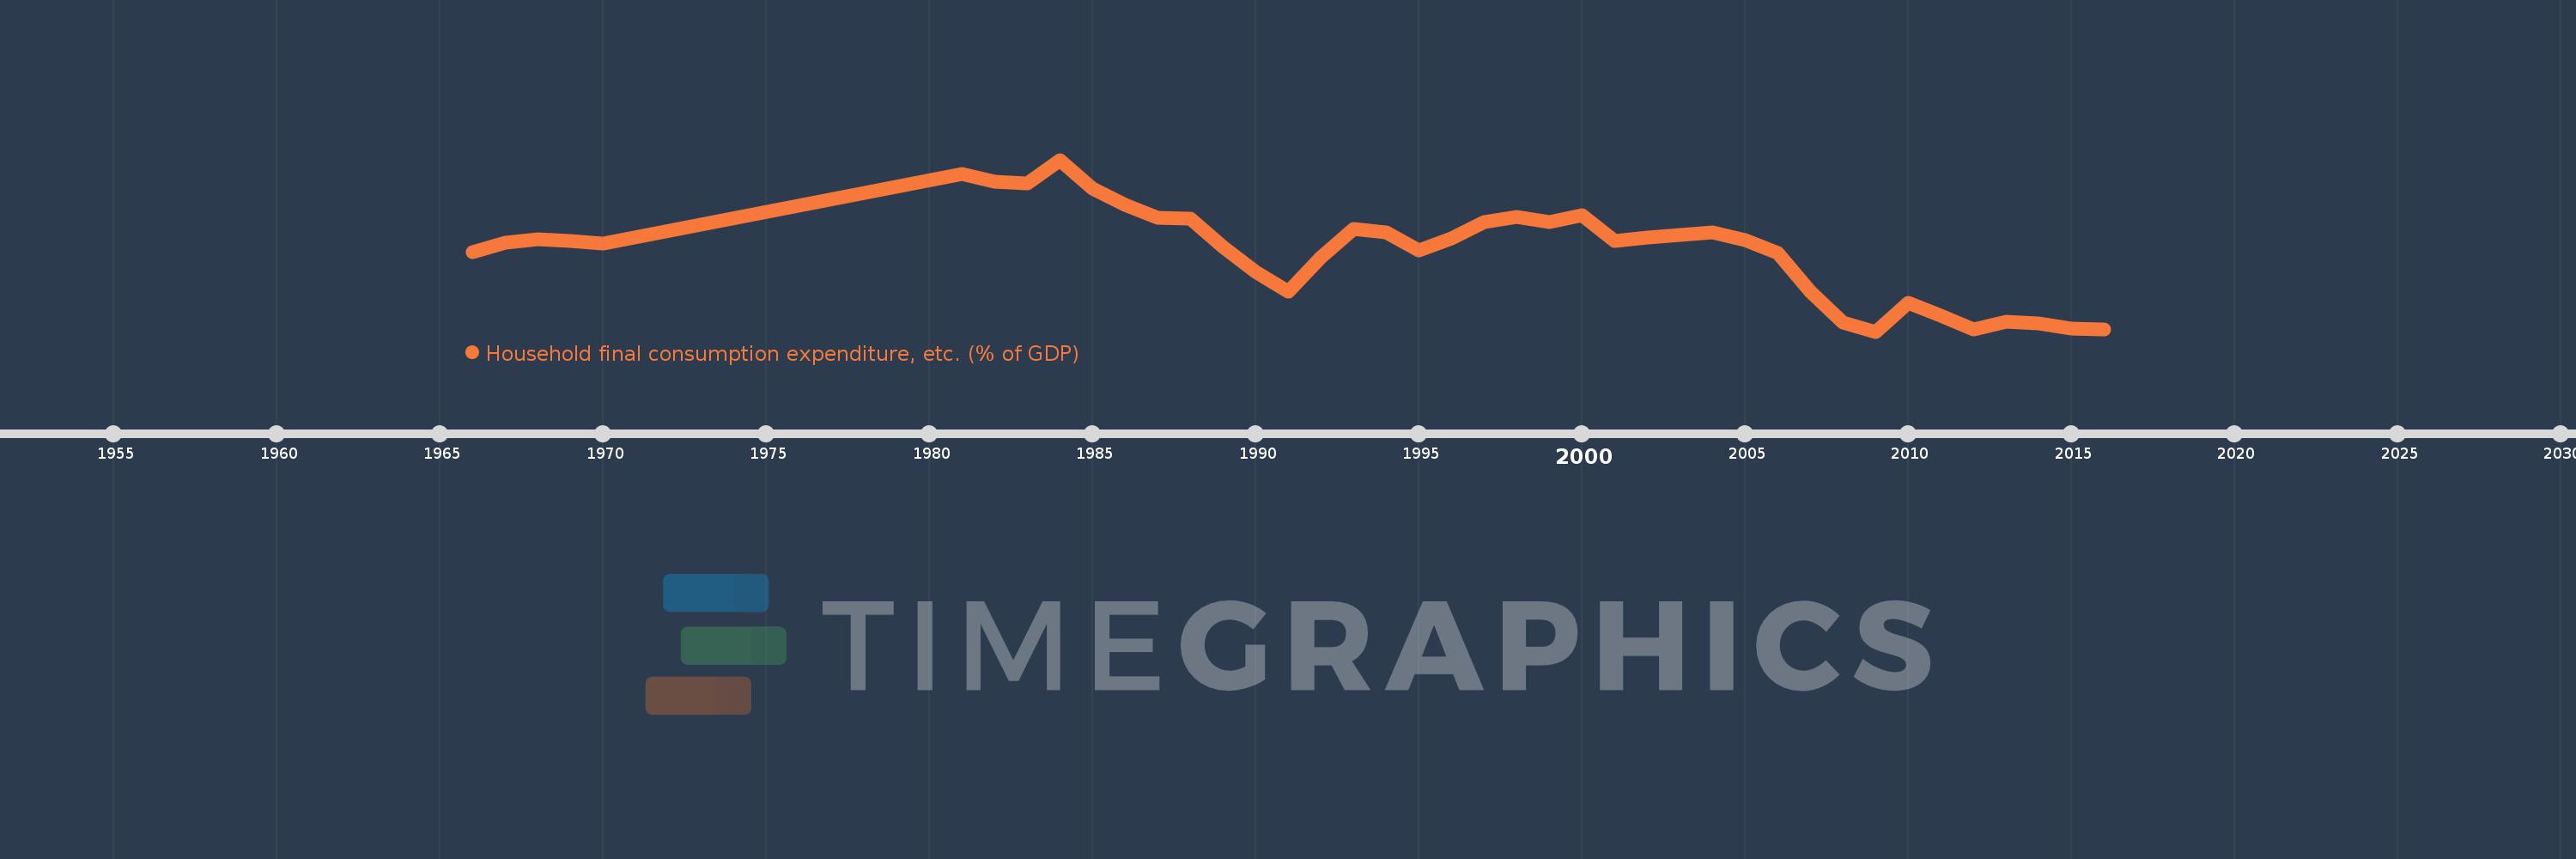
Household final consumption expenditure, etc. (% of GDP)
2016,2015,2014,2013,2012,2011,2010,2009,2008,2007,2006,2005,2004,2003,2002,2001,2000,1999,1998,1997,1996,1995,1994,1993,1992,1991,1990,1989,1988,1987,1986,1985,1984,1983,1982,1981,1970,1969,1968,1967,1966
Queste statistiche in altri paesi:
AfghanistanAlbaniaAlgeriaAngolaAntigua and BarbudaArab WorldArgentinaArmeniaArubaAustraliaAustriaAzerbaijanBahamas, TheBahrainBangladeshBarbadosBelarusBelgiumBelizeBeninBermudaBhutanBoliviaBosnia and HerzegovinaBotswanaBrazilBrunei DarussalamBulgariaBurkina FasoBurundiCabo VerdeCambodiaCameroonCanadaCaribbean small statesCentral African RepublicCentral Europe and the BalticsChadChileChinaColombiaComorosCongo, Dem. Rep.Congo, Rep.Costa RicaCote d'IvoireCroatiaCubaCyprusCzech RepublicDenmarkDjiboutiDominicaDominican RepublicEarly-demographic dividendEast Asia & PacificEast Asia & Pacific (excluding high income)East Asia & Pacific (IDA & IBRD countries)EcuadorEgypt, Arab Rep.El SalvadorEquatorial GuineaEritreaEstoniaEthiopiaEuro areaEurope & Central AsiaEurope & Central Asia (excluding high income)Europe & Central Asia (IDA & IBRD countries)European UnionFaroe IslandsFijiFinlandFragile and conflict affected situationsFranceGabonGambia, TheGeorgiaGermanyGhanaGreeceGrenadaGuatemalaGuineaGuinea-BissauGuyanaHaitiHeavily indebted poor countries (HIPC)High incomeHondurasHong Kong SAR, ChinaHungaryIBRD onlyIcelandIDA & IBRD totalIDA blendIDA onlyIDA totalIndiaIndonesiaIran, Islamic Rep.IraqIrelandIsraelItalyJamaicaJapanJordanKazakhstanKenyaKiribatiKorea, Rep.KosovoKuwaitKyrgyz RepublicLao PDRLate-demographic dividendLatin America & Caribbean Latin America & Caribbean (excluding high income)Latin America & the Caribbean (IDA & IBRD countries)LatviaLeast developed countries: UN classificationLebanonLesothoLiberiaLibyaLithuaniaLow & middle incomeLow incomeLower middle incomeLuxembourgMacao SAR, ChinaMacedonia, FYRMadagascarMalawiMalaysiaMaldivesMaliMaltaMauritaniaMauritiusMexicoMicronesia, Fed. Sts.Middle East & North AfricaMiddle East & North Africa (excluding high income)Middle East & North Africa (IDA & IBRD countries)Middle incomeMoldovaMongoliaMontenegroMoroccoMozambiqueNamibiaNepalNetherlandsNew CaledoniaNew ZealandNicaraguaNigerNigeriaNorth AmericaNorwayOECD membersOmanOther small statesPacific island small statesPakistanPanamaPapua New GuineaParaguayPeruPhilippinesPolandPortugalPost-demographic dividendPre-demographic dividendPuerto RicoQatarRomaniaRussian FederationRwandaSaudi ArabiaSenegalSerbiaSeychellesSierra LeoneSingaporeSlovak RepublicSloveniaSmall statesSolomon IslandsSomaliaSouth AfricaSouth AsiaSouth Asia (IDA & IBRD)South SudanSpainSri LankaSt. Kitts and NevisSt. LuciaSt. Vincent and the GrenadinesSub-Saharan Africa Sub-Saharan Africa (excluding high income)Sub-Saharan Africa (IDA & IBRD countries)SudanSurinameSwazilandSwedenSwitzerlandSyrian Arab RepublicTajikistanTanzaniaThailandTimor-LesteTogoTongaTrinidad and TobagoTunisiaTurkeyTurkmenistanUgandaUkraineUnited Arab EmiratesUnited KingdomUnited StatesUpper middle incomeUruguayUzbekistanVanuatuVenezuela, RBVietnamWest Bank and GazaWorldYemen, Rep.ZambiaZimbabwe Linea del tempo:
Questa scala temporale mostra un grafico dal 1966 anno al 2016 anno. Switzerland. I dati fino ad 1965 anno non disponibili. Il numero di osservazioni attuali secondo i date: 41.
La fonte (nome):
Indicatori dello sviluppo mondiale
La fonte (organizzazione):
World Bank national accounts data, and OECD National Accounts data files.
Categorie:
Economy & Growth
sono stati aggiornati
23 apr 2017 anni
Indicatori delle variazioni dei valori per anni
Minima:
53.811
1 gen 2009 anni
Massimo:
61.815
1 gen 1984 anni
Alla data di osservazione
Valore
Variazione assoluta
La variazione rispetto al valore precedente
1 gen 1966 anni
57.493
+57.493
0.0%
1 gen 1967 anni
57.941
+0.448
0.78%
1 gen 1968 anni
58.098
+0.156
0.27%
1 gen 1969 anni
58.028
-0.07
-0.12%
1 gen 1970 anni
57.924
-0.104
-0.18%
1 gen 1981 anni
61.167
+3.243
5.6%
1 gen 1982 anni
60.778
-0.389
-0.64%
1 gen 1983 anni
60.712
-0.066
-0.11%
1 gen 1984 anni
61.815
+1.103
1.82%
1 gen 1985 anni
60.468
-1.347
-2.18%
1 gen 1986 anni
59.712
-0.756
-1.25%
1 gen 1987 anni
59.113
-0.599
-1.0%
1 gen 1988 anni
59.089
-0.025
-0.04%
1 gen 1989 anni
57.756
-1.332
-2.25%
1 gen 1990 anni
56.578
-1.179
-2.04%
1 gen 1991 anni
55.656
-0.922
-1.63%
1 gen 1992 anni
57.287
+1.631
2.93%
1 gen 1993 anni
58.609
+1.321
2.31%
1 gen 1994 anni
58.452
-0.157
-0.27%
1 gen 1995 anni
57.582
-0.869
-1.49%
1 gen 1996 anni
58.162
+0.58
1.01%
1 gen 1997 anni
58.902
+0.739
1.27%
1 gen 1998 anni
59.162
+0.261
0.44%
1 gen 1999 anni
58.914
-0.249
-0.42%
1 gen 2000 anni
59.231
+0.317
0.54%
1 gen 2001 anni
58.039
-1.192
-2.01%
1 gen 2002 anni
58.199
+0.159
0.27%
1 gen 2003 anni
58.305
+0.106
0.18%
1 gen 2004 anni
58.45
+0.146
0.25%
1 gen 2005 anni
58.068
-0.382
-0.65%
1 gen 2006 anni
57.458
-0.611
-1.05%
1 gen 2007 anni
55.674
-1.783
-3.1%
1 gen 2008 anni
54.214
-1.461
-2.62%
1 gen 2009 anni
53.811
-0.403
-0.74%
1 gen 2010 anni
55.154
+1.343
2.5%
1 gen 2011 anni
54.54
-0.614
-1.11%
1 gen 2012 anni
53.923
-0.617
-1.13%
1 gen 2013 anni
54.267
+0.344
0.64%
1 gen 2014 anni
54.184
-0.082
-0.15%
1 gen 2015 anni
53.948
-0.236
-0.44%
1 gen 2016 anni
53.928
-0.021
-0.04%
Classificazione dei paesi secondo i statistiche attuali per anni


Commenti: