29
/it/
it
AIzaSyAYiBZKx7MnpbEhh9jyipgxe19OcubqV5w
April 1, 2024
123593
Ecuador
ECU
true
2
1
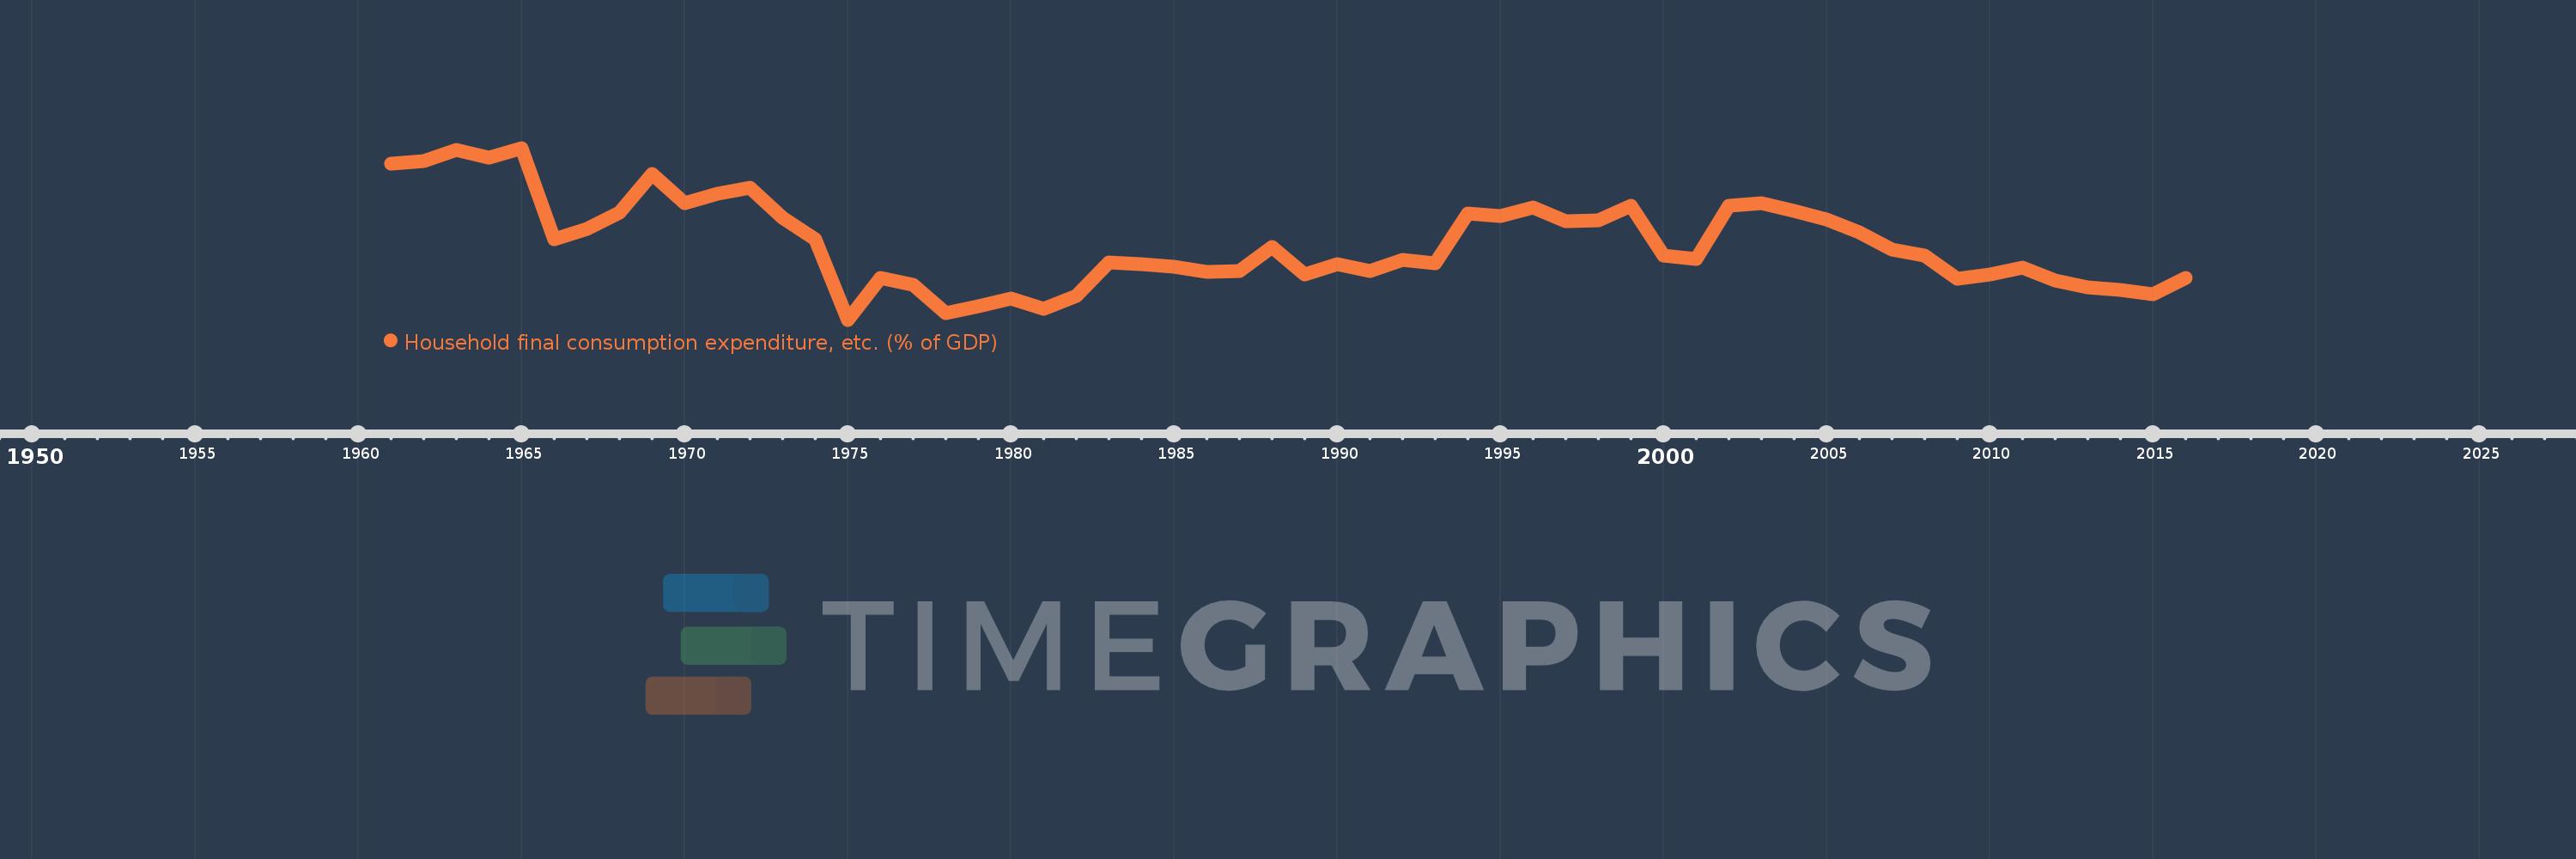
Household final consumption expenditure, etc. (% of GDP)
2016,2015,2014,2013,2012,2011,2010,2009,2008,2007,2006,2005,2004,2003,2002,2001,2000,1999,1998,1997,1996,1995,1994,1993,1992,1991,1990,1989,1988,1987,1986,1985,1984,1983,1982,1981,1980,1979,1978,1977,1976,1975,1974,1973,1972,1971,1970,1969,1968,1967,1966,1965,1964,1963,1962,1961
Queste statistiche in altri paesi:
AfghanistanAlbaniaAlgeriaAngolaAntigua and BarbudaArab WorldArgentinaArmeniaArubaAustraliaAustriaAzerbaijanBahamas, TheBahrainBangladeshBarbadosBelarusBelgiumBelizeBeninBermudaBhutanBoliviaBosnia and HerzegovinaBotswanaBrazilBrunei DarussalamBulgariaBurkina FasoBurundiCabo VerdeCambodiaCameroonCanadaCaribbean small statesCentral African RepublicCentral Europe and the BalticsChadChileChinaColombiaComorosCongo, Dem. Rep.Congo, Rep.Costa RicaCote d'IvoireCroatiaCubaCyprusCzech RepublicDenmarkDjiboutiDominicaDominican RepublicEarly-demographic dividendEast Asia & PacificEast Asia & Pacific (excluding high income)East Asia & Pacific (IDA & IBRD countries)EcuadorEgypt, Arab Rep.El SalvadorEquatorial GuineaEritreaEstoniaEthiopiaEuro areaEurope & Central AsiaEurope & Central Asia (excluding high income)Europe & Central Asia (IDA & IBRD countries)European UnionFaroe IslandsFijiFinlandFragile and conflict affected situationsFranceGabonGambia, TheGeorgiaGermanyGhanaGreeceGrenadaGuatemalaGuineaGuinea-BissauGuyanaHaitiHeavily indebted poor countries (HIPC)High incomeHondurasHong Kong SAR, ChinaHungaryIBRD onlyIcelandIDA & IBRD totalIDA blendIDA onlyIDA totalIndiaIndonesiaIran, Islamic Rep.IraqIrelandIsraelItalyJamaicaJapanJordanKazakhstanKenyaKiribatiKorea, Rep.KosovoKuwaitKyrgyz RepublicLao PDRLate-demographic dividendLatin America & Caribbean Latin America & Caribbean (excluding high income)Latin America & the Caribbean (IDA & IBRD countries)LatviaLeast developed countries: UN classificationLebanonLesothoLiberiaLibyaLithuaniaLow & middle incomeLow incomeLower middle incomeLuxembourgMacao SAR, ChinaMacedonia, FYRMadagascarMalawiMalaysiaMaldivesMaliMaltaMauritaniaMauritiusMexicoMicronesia, Fed. Sts.Middle East & North AfricaMiddle East & North Africa (excluding high income)Middle East & North Africa (IDA & IBRD countries)Middle incomeMoldovaMongoliaMontenegroMoroccoMozambiqueNamibiaNepalNetherlandsNew CaledoniaNew ZealandNicaraguaNigerNigeriaNorth AmericaNorwayOECD membersOmanOther small statesPacific island small statesPakistanPanamaPapua New GuineaParaguayPeruPhilippinesPolandPortugalPost-demographic dividendPre-demographic dividendPuerto RicoQatarRomaniaRussian FederationRwandaSaudi ArabiaSenegalSerbiaSeychellesSierra LeoneSingaporeSlovak RepublicSloveniaSmall statesSolomon IslandsSomaliaSouth AfricaSouth AsiaSouth Asia (IDA & IBRD)South SudanSpainSri LankaSt. Kitts and NevisSt. LuciaSt. Vincent and the GrenadinesSub-Saharan Africa Sub-Saharan Africa (excluding high income)Sub-Saharan Africa (IDA & IBRD countries)SudanSurinameSwazilandSwedenSwitzerlandSyrian Arab RepublicTajikistanTanzaniaThailandTimor-LesteTogoTongaTrinidad and TobagoTunisiaTurkeyTurkmenistanUgandaUkraineUnited Arab EmiratesUnited KingdomUnited StatesUpper middle incomeUruguayUzbekistanVanuatuVenezuela, RBVietnamWest Bank and GazaWorldYemen, Rep.ZambiaZimbabwe Linea del tempo:
Questa scala temporale mostra un grafico dal 1961 anno al 2016 anno. Ecuador. I dati fino ad 1960 anno non disponibili. Il numero di osservazioni attuali secondo i date: 56.
La fonte (nome):
Indicatori dello sviluppo mondiale
La fonte (organizzazione):
World Bank national accounts data, and OECD National Accounts data files.
Categorie:
Economy & Growth
sono stati aggiornati
23 apr 2017 anni
Indicatori delle variazioni dei valori per anni
Minima:
55.419
1 gen 1975 anni
Massimo:
81.208
1 gen 1965 anni
Alla data di osservazione
Valore
Variazione assoluta
La variazione rispetto al valore precedente
1 gen 1961 anni
78.821
+78.821
0.0%
1 gen 1962 anni
79.216
+0.394
0.5%
1 gen 1963 anni
80.874
+1.658
2.09%
1 gen 1964 anni
79.807
-1.066
-1.32%
1 gen 1965 anni
81.208
+1.401
1.76%
1 gen 1966 anni
67.512
-13.696
-16.87%
1 gen 1967 anni
69.095
+1.582
2.34%
1 gen 1968 anni
71.538
+2.444
3.54%
1 gen 1969 anni
77.321
+5.783
8.08%
1 gen 1970 anni
72.879
-4.441
-5.74%
1 gen 1971 anni
74.316
+1.436
1.97%
1 gen 1972 anni
75.198
+0.883
1.19%
1 gen 1973 anni
70.661
-4.537
-6.03%
1 gen 1974 anni
67.449
-3.212
-4.55%
1 gen 1975 anni
55.419
-12.03
-17.84%
1 gen 1976 anni
61.75
+6.33
11.42%
1 gen 1977 anni
60.696
-1.054
-1.71%
1 gen 1978 anni
56.434
-4.262
-7.02%
1 gen 1979 anni
57.449
+1.015
1.8%
1 gen 1980 anni
58.641
+1.192
2.07%
1 gen 1981 anni
57.063
-1.578
-2.69%
1 gen 1982 anni
58.98
+1.918
3.36%
1 gen 1983 anni
64.001
+5.021
8.51%
1 gen 1984 anni
63.703
-0.298
-0.47%
1 gen 1985 anni
63.325
-0.379
-0.59%
1 gen 1986 anni
62.641
-0.684
-1.08%
1 gen 1987 anni
62.669
+0.028
0.04%
1 gen 1988 anni
66.31
+3.641
5.81%
1 gen 1989 anni
62.265
-4.045
-6.1%
1 gen 1990 anni
63.776
+1.511
2.43%
1 gen 1991 anni
62.692
-1.084
-1.7%
1 gen 1992 anni
64.463
+1.771
2.83%
1 gen 1993 anni
63.93
-0.533
-0.83%
1 gen 1994 anni
71.418
+7.488
11.71%
1 gen 1995 anni
70.975
-0.443
-0.62%
1 gen 1996 anni
72.299
+1.324
1.87%
1 gen 1997 anni
70.256
-2.043
-2.83%
1 gen 1998 anni
70.369
+0.113
0.16%
1 gen 1999 anni
72.523
+2.153
3.06%
1 gen 2000 anni
65.05
-7.472
-10.3%
1 gen 2001 anni
64.581
-0.47
-0.72%
1 gen 2002 anni
72.501
+7.921
12.27%
1 gen 2003 anni
72.857
+0.356
0.49%
1 gen 2004 anni
71.741
-1.116
-1.53%
1 gen 2005 anni
70.473
-1.268
-1.77%
1 gen 2006 anni
68.509
-1.965
-2.79%
1 gen 2007 anni
65.982
-2.527
-3.69%
1 gen 2008 anni
65.091
-0.891
-1.35%
1 gen 2009 anni
61.512
-3.579
-5.5%
1 gen 2010 anni
62.242
+0.73
1.19%
1 gen 2011 anni
63.276
+1.035
1.66%
1 gen 2012 anni
61.376
-1.9
-3.0%
1 gen 2013 anni
60.288
-1.088
-1.77%
1 gen 2014 anni
59.857
-0.431
-0.72%
1 gen 2015 anni
59.2
-0.657
-1.1%
1 gen 2016 anni
61.756
+2.555
4.32%
Classificazione dei paesi secondo i statistiche attuali per anni


Commenti: